7 Chapter 7: Learning from Oxymorons I – Ecological Economics
An oxymoron is an apparent contradiction in terms like “open secret” or “jumbo shrimp.” That’s how you may at first view the term “ecological economics,” but let’s see if we can find in it a consistent logic that’s helpful in understanding natural resource sustainability. Ecological economics is a relatively new school of thought, originating in the 1980s, but it has expanded very rapidly as more and more economists come to see the value in taking the Earth and sustainability seriously and as more and more ecologists come to realize that humans dominate most ecosystems. Of course, ecological economics uses all of the ideas we studied in Chapter 4 on ecology and in Chapter 6 on neoclassical economics, but in integrating these it also adds new ideas and a different perspective that challenges neoclassical economic approaches.
An Ecological Economics Perspective
As we have seen, neoclassical economics takes efficiency and economic growth as its normative goals. Ecological economics, in contrast, strives for sustainability. Does this mean that it takes the view that humans have reached or exceeded their ecological carrying capacity and that we’re all doomed? Anglican clergyman Thomas Malthus first proposed this idea in 1798, and such ideas are often labeled “Malthusian” to this day. In 1972, at the peak of world population growth rates and just before the OPEC oil embargo, a group called the Club of Rome built a computer model of the interactions among population, resources, the environment, agricultural, and industrial production. Their The Limits to Growth study concluded that, under current trends, the world would run out of resources, leading to a global collapse. Even if new technologies like nuclear fusion unleashed huge new resource opportunities, the globe would still be overcome by pollution as agricultural and industrial production soar exponentially. The message was that only an immediate stop to population and economic growth can save us all from an Easter Island or Mayan-like global collapse.
Ecological economics rejects this modern version of Malthusianism. It also rejects, however, the “Promethean” denial of ecological limits to economic growth articulated by scholars such as Julian Simon in his The Ultimate Resource and, in more contemporary form, Bjorn Lomborg in The Skeptical Environmentalist. These authors argue that technological innovation and capitalist markets can overcome any environmental limitation. We need a more nuanced view that lies between these extremes.
Ecological economics offers the idea of increasing marginal ecological opportunity costs associated with economic growth that is driven by resource consumption. As human economies co-opt a larger and larger share of the biosphere’s energy and materials and release increasing quantities of waste, the incremental ecological impacts of economic growth rise, and the flow of ecosystem services to society diminishes at an accelerating rate. That’s a mouthful, so let’s explore this notion in more detail.
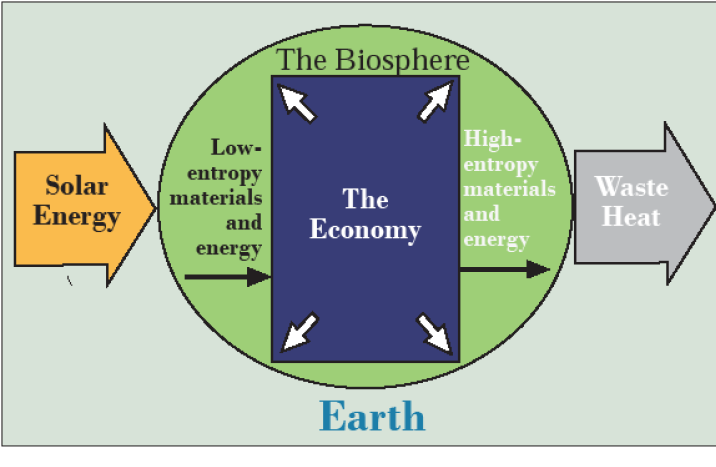
Figure 7.1 shows the Earth’s biosphere running on low entropy, high-quality solar energy and emitting high entropy, low-quality waste heat, just like your car runs on gasoline and emits exhaust. Entropy, a key concept in thermodynamics, means that concentrated or structured forms of energy—solar radiation, electricity, the chemical energy in gasoline—can perform work, but in doing so will dissipate into generic forms of energy like heat that spreads evenly throughout its environment and cannot do work. The biosphere can’t run on waste heat and your car can’t run on its own exhaust. Applied to raw materials, pure copper, for example, has low entropy, one percent copper ore has high entropy, and ordinary rocks that contain the average concentration of copper in the Earth’s crust are at maximum entropy. The same could be said of high-entropy generic mixed trash and low-entropy sorted recyclable materials. Like the Earth and your car, your body runs on the entropy difference between (a) the high oxygen-content air you inhale, the calorie, vitamin, and protein-rich food you eat, and the pure, treated water you drink compared to (b) the high carbon dioxide air you exhale, the heat radiating from your 98–99°F body, and what you flush down the toilet.
The human economy is a subset of the biosphere, but it is a growing proportion of that whole (the white arrows expanding the blue box in Figure 7.1) as we have seen in previous chapters. What is the relationship between the economy and the biosphere? Of course, the economy uses low-entropy natural resources produced by the biosphere in the distant past (e.g., fossil fuels, ores), more recent past (e.g., soils, forests, fresh water) ,and the present (e.g., solar energy). It emits high-entropy waste such as heat and pollution to the biosphere. So the economy runs on the entropy differential between natural resource inputs and waste outputs just like you and the Earth. Physicists call all of these—the biosphere, the economy, your body—distributive structures because they all maintain their dynamic internal complexity only by continuously taking in high-quality energy and raw materials and emitting high-entropy waste.
Let’s penetrate the relationship between the biosphere and the economy a little deeper by traveling the pathways in Figure 7.2 below. At the heart (in the sense of a pump at the center of a circulatory system) is the market economy (the purple diamond). The output of the market economy is gross product as we have seen, but it is also the engine that integrates and transforms one form of capital into another. There are five different forms of capital shown: manufactured (in blue), intellectual (in orange), human (in red), natural (of course in green), and social (lurking in the background in—we’ll call it mauve).
Capital is like a savings account, a fund that generates an ongoing flow of goods and services. The economic concept of capital is derived from manufactured capital and its critical role in the Industrial Revolution. Its symbol is the factory, but all around us is manufactured capital—the building you are in and the furniture you’re sitting on, the road you traveled on and the vehicle you traveled in, the computer you’re using and the electrical power plants and transmission lines that are powering it, the water supply system that enabled you to fill your water bottle at the faucet. Everything that humans have built and is not immediately consumed but stands in place as a resource for future productive use is manufactured capital. The Industrial Revolution represents an explosion in manufactured capital, and “developed” countries have a lot more of it than “developing” countries. Manufactured capital provides the infrastructures that are used for the production of goods and services, but it will depreciate unless it is maintained, updated, and expanded through new investment allocated as a portion of gross product. Currently in Washington, DC, one of the few things Republicans and Democrats can agree upon is that we need to increase investment in infrastructure—publicly provided manufactured capital.
Intellectual capital is accumulated knowledge that is written down in some sort of language where it can be accessed as needed—all the books, newspaper articles, websites and scientific journals, all the computer programs and data sets, all the blueprints and construction schematics, all the technologies, all the exploding reams of information in the information revolution we are currently experiencing. Intellectual capital has to be produced through investments in research and development, inventing and writing. Unlike manufactured capital that wears out, once made available, intellectual capital can be used again and again and by many people simultaneously without depreciation. It usually becomes obsolete, however, and loses its value over time. Only a small portion—like Shakespeare’s plays, the Declaration of Independence, and Albert Einstein’s equations —stands the test of time. I’d be very pleasantly surprised if this text was still in use 20 years from now. Most news stories, Twitter and text messages, social media postings, and web page materials lose their significance in a matter of weeks or even days—that is, if they had any significance to begin with. Those of us who learned to separate the “signal” from the “noise” in the 20th century find the 21st to be the Century of Noise.
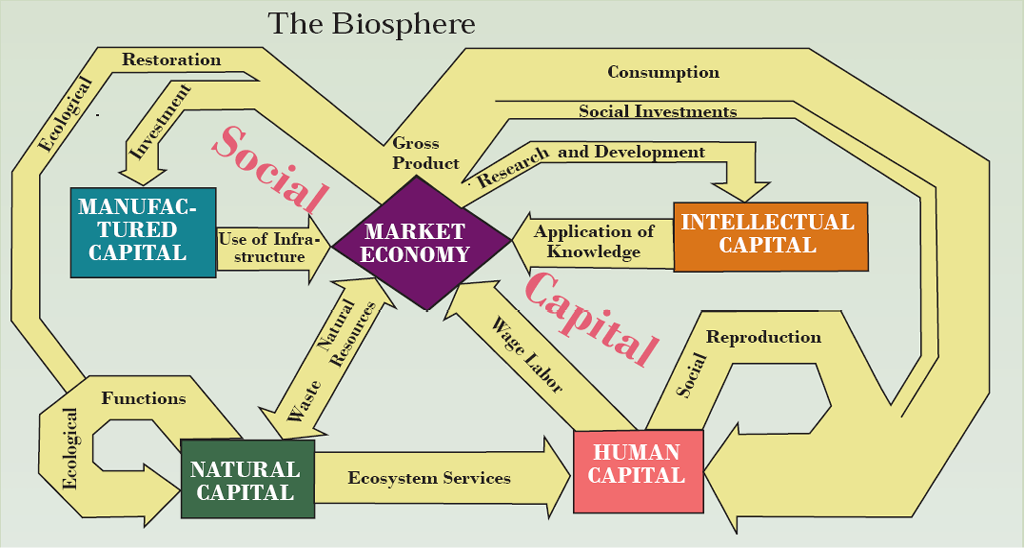
Human capital resides within us as individuals. It is the knowledge and experiences in our brains, our physical skills, our powers of personality, and our character. These characteristics become inputs to the market economy through our jobs, and the more we have to offer, the more income-earning potential we have. Social investments like health care and education deliberately and directly invest in human capital because they maintain and expand the capabilities of individuals. The food, water, and shelter we need to survive and many other good and services we receive are also investments in human capital.
There clearly comes a point, however, where additional consumption is not an investment in, but may even depreciate, human capital. More is not always better. Is it a coincidence that obesity and screen time are increasing at the same rate? Moreover, human capital is not nurtured solely, or even primarily, through purchased or allocated goods and services but through the village that it takes to raise a child—communities defined by neighborhoods, school classes, sports teams, congregations, and perhaps Twitter, Facebook, and text messaging, though that is the subject of an intensifying debate. Families are also, of course, a cornerstone of what we’ll call social reproduction for short.
Natural capital is not created and reproduced by humans, but by geological processes and, even more so, by ecological functions, as we studied in Chapter 3 and 4. It is the natural resources we depend upon today and will depend upon tomorrow—the fossil fuels and ores in the Earth, the soil and forests upon it, and the water running through it. It is also the ecosystems that photosynthesize, maintain biodiversity and build soil, recycle nutrients, and break down wastes and pollutants from human activities. Extracting natural resources faster than ecosystems can replace them and emitting wastes faster than ecosystems can process them depreciates the fund of natural capital available for the future. That’s unsustainable, just like a savings account from which we withdraw money faster than it is replenished with new deposits and interest payments; in the long run, it will run out. On the other hand, deliberate investments in ecological restoration can complement ecological functions in restoring natural capital.
Natural capital is the factory that produces ecosystem services to benefit people. In a famous 1997 paper on “The Global Value of Natural Capital and Ecosystem Services,” updated in 2014, Robert Costanza and colleagues estimated that the value of these services is, on a global scale, a total of $125 trillion dollars (see Table 7.1), about twice the value of global economic output and about $17,000 per person per year. While such estimates are rarely accurate, natural capital delivers enormous benefits directly to humans through provisioning, cultural, regulatory, and supporting ecosystem services— like a savings account delivers interest payments. Interestingly, ecosystems at the interface of land and water (estuaries at river mouths, swamps and floodplains along rivers, seagrass and algae beds in the shallow seas, tidal marshes and mangroves at the seacoast, freshwater lakes and rivers, and coral reefs along tropical coasts) provide 40 percent of all ecosystem services on 1.6 percent of the Earth’s surface. These “ecological cities” should receive, along with tropical rainforests for their biodiversity, the highest priority for preservation.
Table 7.1. Area and estimated economic value of ecosystem services from Earth’s biomes.
| Total | 51,625 | 124.8 | |
| Ecosystem type | Area (million year) | Value (2007$ per hectare per 2007$) | Total value (trillion ha) |
|---|---|---|---|
| Marine | 36,302 | 1,368 | 49.7 |
| Open Ocean | 33,200 | 660 | 21.9 |
| Coastal | 3,102 | 8,944 | 27.7 |
| Estuaries | 180 | 28,916 | 5.2 |
| Seagrass/Algae Beds | 234 | 28,916 | 6.8 |
| Coral Reefs | 28 | 352,249 | 9.9 |
| Continental Shelf | 2,660 | 2,222 | 5.9 |
| Terrestrial | 15,323 | 4,901 | 75.1 |
| Forest | 4,261 | 3,800 | 16.2 |
| Tropical | 1,258 | 5,382 | 6.8 |
| Temperate/Boreal | 3,003 | 3,137 | 9.4 |
| Grass/Rangelands | 4,418 | 4,166 | 18.4 |
| Wetlands | 188 | 140,174 | 26.4 |
| Tidal Marsh/Mangroves | 128 | 193,843 | 24.8 |
| Swamps/Floodplains | 60 | 25,681 | 1.5 |
| Lakes/Rivers | 200 | 12,512 | 2.5 |
| Desert | 2,159 | – | – |
| Tundra | 433 | – | – |
| Ice/Rock | 1,640 | – | – |
| Cropland | 1,672 | 5.567 | 9.3 |
| Urban | 352 | 6,661 | 2.3 |
Social capital is more subtle, and definitions of it abound. Robert Putnam in Bowling Alone defines it as “features of social organization such as networks, norms, and social trust that facilitate coordination and cooperation for mutual benefit.” We live in communities of family, friends, and acquaintances, (even if Putnam thinks these are unraveling) and interact through institutions such as churches, schools, businesses, governments, and social media. We are governed by laws, but also by a social fabric of rules of conduct and social norms. For our purposes, social capital is the rules that societies construct to govern how the other forms of capital will interact, from the constitution of the United States of America, to the institution of private property, to recently developed cultural norms that stigmatize as rude behavior throwing trash out the window of a moving car or smoking in a crowded room, or that govern expectations on responding to text messages quickly vs. emails in a few days.
Geographical Ecological-Economics
The ecological economics perspective presented above is enormously useful and insightful in considering issues of sustainability, but it fails to consider geography. How do the processes depicted in Figure 7.2 operate over and through geographic space? How mobile are different forms of capital? What roles do natural capital and ecosystem services play in defining places and providing benefits that accrue to specific people? It is clear that some forms of capital, such as financial capital, are so mobile that billions of dollars are routinely transferred between continents every day in the nearly costless world of the Internet. Intellectual and written forms of social capital can also be transported simply by pressing “send.” People, as carriers of human capital, have to be actually transported, by foot, bike, car, train, or airplane. They often migrate, such as from rural to urban and suburban areas or from developing to developed countries. The movement of manufactured capital in the form of produced goods is the heart of transportation and continues to increase due to globalization. The human and economic geography of specific places are partially defined by their roads, railroads, and ports, their electricity lines, water and gas pipelines, and their buildings that are geographically fixed.
In these terms, the mobility of natural capital depends upon its form. As a stock of natural resources, raw materials such as fossil fuels, ores, timber, and fresh water constitute the vast majority of freight moved by trucks, ships, trains, and pipelines. These components of natural capital nearly always have lower economic value per unit weight, however, than the manufactured goods for which they serve as raw materials. Ore refining is therefore most efficiently located at the mine and thermoelectric power plants at large sources of cooling water to avoid transporting these voluminous production inputs.
As an endowment that provides ecosystem services, however, natural capital is essentially immobile. Ecosystems cannot be picked up and moved. Moreover, climate, topography, hydrography, and other conditions that govern the formation of ecosystems are tied to geographical places. There is, therefore, great variation in the ecosystem services available to different places and regions. Regions such as the Sahara Desert, Siberia, or the Australian outback, for example, are sparsely populated partly due to the dearth of ecosystem services they offer. In contrast, the world’s most densely populated areas—east Asia, south Asia, Europe, the eastern U.S.—can support so many people precisely because of their abundant ecosystem services. When we study basic physical geography in primary and secondary school, we are often describing the geography of natural capital, though generally neglecting that this geography is dynamic.
While immobile, the geography of natural capital changes as a result of four factors:
- natural dynamics in ecological functions,
- human influences on these through activities such as land transformation and engineering of water courses,
- direct human depreciation of natural capital funds through the introduction of waste, and
- directly harvesting natural resources.
Climate change is an intriguing example where the benefits of fossil fuel use—concentrated in the industrial regions of North America, Europe, Russia, and China—largely coincide with the geography of emissions of greenhouse gases to the global atmospheric carbon pool. While climate change is affecting hydrologic, agricultural, and ecological systems across the globe, the most severe consequences are distributed very differently from the emissions. Polar regions, coastlines and island nations, populous river floodplains and deltas, drought-prone agricultural areas, and impoverished regions of the tropics, especially in Africa, bear the greatest burden of changes in ecosystem services brought about by climate change. In this manner, the global atmospheric carbon pool is a mechanism through which ecosystem services are redistributed geographically, perhaps leading to some resentment of high-emission countries such as China and the U.S.
When we go from the abstract to the concrete, what we find is specific, on-the-ground ecosystems that deliver ecosystem services to specific, usually very nearby, human communities that rely on these services for their welfare. An ecosystem service like flood control may be extraordinarily valuable when it is provided immediately upstream of a city, but it is of little value in the wilderness of northern Canada or Alaska. Environmental aesthetics and outdoor recreational opportunities are similarly more valuable in densely than in sparsely populated regions. For some ecosystem services like carbon sequestration, however, geography matters little because the atmospheric carbon pool is global.
The Ecological Economics Challenge to Neoclassical Economics
Let’s explore the relationships between the Earth, the biosphere, and the economy a bit further. As total economic output (gross product) expands, it produces benefits to people as they get, first, necessities like food, water, and shelter, then fundamental services like education, health care, and electricity, then middle-class accoutrements like nice furniture and dishes, TVs, computers and cell phones, cars and vacations, restaurant meals, presentable and functional clothing, college educations, and so forth, and then perhaps true luxuries like yachts, foreign junkets, fine wardrobes, jewelry, and the like. The idea here is that each additional unit of income adds to our quality of life, but to a lesser and lesser extent as we meet more and more of our essential needs and start spending money on extra stuff, even conspicuous consumption. This is just like the pizza slices of Chapter 6 but applied to our entire income—income yields diminishing marginal returns to quality of life as people get more and more of it. In Figure 7.3 this makes the total benefits curve in the top graph climb at a slower and slower rate and the marginal benefits of economic growth curve on the bottom graph trend downward.
We don’t want to take moralizing about needs, wants, and luxuries too far, however. As a young adult without children, it’s easier to live on the cheap than as a parent or as an older person with less physical wherewithal than a person in their 20s. Speaking for myself (as a middle-aged, primary bread winner with two children whose college tuition I recently completed paying for), I’ll keep my family’s middle-class accoutrements and the income that makes them possible, thank you very much. And nearly every member of the growing world middle class feels the same way. The notion that the majority of people will, as individuals, altruistically sacrifice their economic welfare for sustainability is unrealistic, but that doesn’t mean we can’t make enormous progress, as we will see.
It’s also clear that as the economy extracts more and more resources and emits more and more waste, the ecological costs climb. In fact, they climb at a higher and higher rate as fewer ecosystems are left intact and their services diminish. This is the clear message from the 2005 Millennium Ecosystem Assessment and the 2019 report from the Intergovernmental Science-Policy Platform on Biodiversity and Ecosystem Services we studied in Chapter 4. In Figure 7.3, this is reflected in the rapidly rising total ecological opportunity costs curve at the top and the rising marginal ecological opportunity costs curve at the bottom.
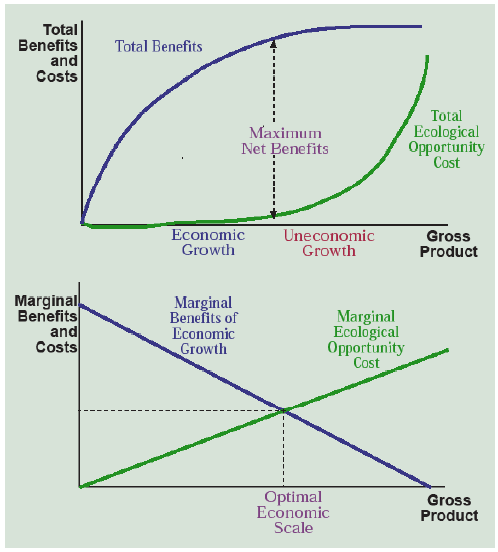
Drawing on the logic of optimal pollution from Chapter 6, what is the “best” level of gross product? Neoclassical economics would say its infinite—the more the better, that’s the goal. But ecological economics would say that we want to maximize the difference between the economic benefits and the ecological costs of economic growth. This produces maximum net benefits. So economic growth, increases in gross product, up to this point are good—they raise net benefits—but if gross product keeps going up, net benefits start to shrink. This then becomes uneconomic growth.
On the bottom graph in Figure 7.3, we see that the optimal economic scale occurs where the marginal economic benefits and the marginal ecological costs are equal. That is the point where the ecological costs of increasing gross product a bit more rise to the point where they equal or surpass the economic benefits of doing so. It is here that we should stop increasing gross product. Sounds simple enough but, for over a century, economic growth has been the driving force, the raison d’etre, the purpose and goal of nations around the world, with the U.S. being a prime example.
Taking the North American example, think about how the relative size (in Figure 7.2) of the manufactured, intellectual, human, and natural capital funds have changed over the last few centuries. In colonial times, there was a vast frontier fully stocked with all forms of natural capital—minerals, forests, rivers, aquifers, fish, and fertile soil. No one even thought of ecosystem services because they were so abundant and therefore taken for granted, as oxygen still is today. It was human-derived forms of capital that were scarce and therefore the limiting factor in human development. Westward expansion and industrialization enabled this surplus of natural capital to be transformed into manufactured, intellectual, and human capital, and the nation and economy grew. And we were better off for it—that is, we had been proceeding along the x-axis of Figure 7.3 from the origin and hadn’t yet approached the optimal economic size.
Today, things are different. The U.S. has about a third of a billion educated people living in modern cities and towns in an information age—human capital is abundant! In contrast, oil supplies are running low, virgin forests are nearly gone, many soils have been depleted or eroded, fish stocks have plummeted, wild species of mammals and birds are a diminishing fragment compared to domesticated species, and half of the wetlands have been drained—our ecosystems are battered. Today, natural capital is more often the limiting factor in social development than was the case in the past. Therefore, the marginal value of remaining natural capital and ecosystem services has increased, implying that there are increasing marginal ecological opportunity costs when natural capital depreciates and ecosystem services are diminished. Moreover, technology has greatly accelerated the production of human forms of capital such as infrastructures and computer algorithms, but natural capital can be restored only on much longer time scales and does not respond as readily to technological advances. For this reason, the stock of natural capital within the biosphere and the rate at which it can produce energy, raw materials, and ecosystem services are the long-term limiting factors in human social development.
We are now in a position to consider more precisely what we mean by sustainability. What if Figure 7.2 was a movie, the capital rectangles were buckets of water, and the arrows were pipes? We have already seen that over historical time the natural capital bucket would be emptying while the other buckets would be filling. When does the movie end? When any one of the buckets goes dry. Why?
Manufactured, intellectual, human, and natural capital are interdependent parts of a nature-society-economy system, just like your muscles, nerves, digestive tract, and blood vessels are inter-dependent parts of your body. If any one of these becomes dysfunctional, none of the others can function and the entire system collapses.
Weak sustainability consists of maintaining the aggregate value of human, manufactured, intellectual, and natural capital. If these forms of capital are not completely substitutable, however, critical shortages in any one form of capital can cripple the entire system, just like a burst blood vessel in the brain causes a stroke which breaks down the nervous system, which paralyzes the muscles, and so forth. Capital depreciation in any area is the harbinger of long-term system decline.
Strong sustainability maintains that, for the system to function in perpetuity, the value of each form of capital must be maintained because different forms of capital are rarely substitutable. Occasionally, we can, at considerable expense, replace natural capital with manufactured capital, such as building a wastewater treatment plant to replace wetlands, or hydroponics to replace soil. More often, however, we cannot replace natural capital. Tropical rainforests cannot be produced in a factory or by writing a computer algorithm.
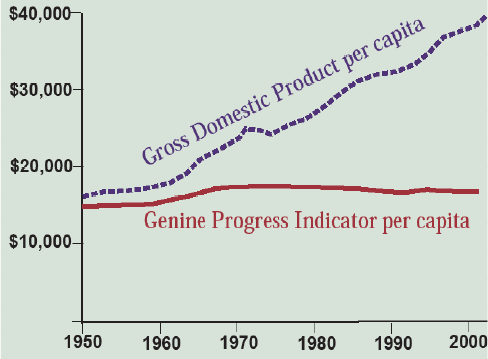
The depreciation of natural capital has become the focus of programs for reform of national income accounts—the ledgers that are used to measure gross product and the current measure of economic growth. Robert Repetto first brought this issue to the attention of global financial institutions by showing that Costa Rica’s rapid economic growth in the 1970s and 1980s occurred alongside a depreciation of its forest and soil resources. When natural capital depreciation was calculated, a vigorous 4 percent rate of economic growth was shown to be, in fact, an economic decline. This debate about the measurement of economic vs. ecological-economic performance is central to assessing sustainability. For example, the Genuine Progress Indicator (GPI) developed by Redefining Progress, starts with gross product but adjusts for the distribution of income, adds in the value of volunteer work and parenting, and subtracts the costs of crime, pollution, and resource depletion. When the GPI is compared to the GDP for the U.S. over the period 1970–2004 (Figure 7.4), the apparent growth in per capita income from $25,000–$38,000 is shown to be illusory as the Genuine Progress Indicator shows stagnation at a level of about $17,000 per capita. The overall welfare of the average American hadn’t improved in 34 years. And this was before the Great Recession and the Covid-19 crisis! Another example is the Index of Sustainable Economic Welfare used by several European countries as a measuring stick of sustainable development.
Now this all sounds pretty pessimistic, but let’s think about it some more. What if we can use the vast expansion in intellectual capital that characterizes the information age to figure out how to reduce the ecological costs of economic growth? Since the Industrial Revolution, economic growth has meant extracting more fossil fuels and minerals, using more energy and water, building more vehicles and the roads and parking lots for them, sprawling the suburbs with big houses and filling them with furniture and electronics, filling the supermarkets with meat and the fast food restaurants with trash. This kind of economic growth has high ecological opportunity costs! But what if we pursue economic growth differently? We make everything energy efficient—lights, buildings, vehicles, appliances—and power it all with lower impact sources of electricity—like wind and solar, perhaps modular nuclear. We build energy-efficient hyperloop lines between cities and subway systems within cities, reversing suburban sprawl and making more walkable and bikeable cities and towns, drastically reducing passenger miles driven and flown. The hyperloop and subway stations become the hubs of commerce with energy-efficient houses with solar roofs clustered around them. People reduce meat consumption and replace fast food burgers in favor of local produce and relearn how to cook for family and friends. Pesticides become obsolete. The use of services like excellent education, health care, and culturally-enriching entertainment are the signs of wealth and status rather than a huge trophy house filled with stuff and three SUVs and pickup trucks in the garage. I think you get the picture but we’ll explore it further in Chapter 16.
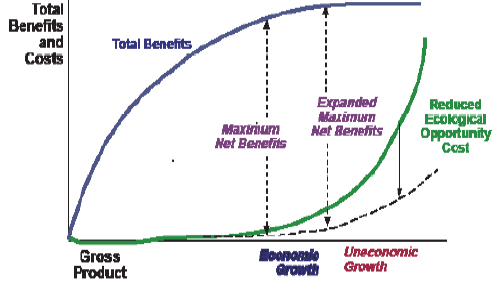
When the ecological costs of economic growth are reduced (compare Figure 7.3 with Figure 7.5), many good things happen. Net benefits widen. The optimal size of the economy expands, yet ecological damages are reduced. Would you vote for that? I think this is what we’re shooting for. It’s an economic strategy to live both well and sustainably. But it’s also a lot easier said than done. It requires change. We can’t grow the economy in the same old way. We have to grow it in a new way.
Industrial economies, especially in North America, have evolved in a world where labor and manufactured capital were scarce and therefore had to be used very efficiently to maximize product output per unit of labor and manufactured capital. This has made workers enormously productive. For example, the average North American farmer feeds over 150 people. In contrast, since natural capital was in abundance, it could be used inefficiently. This is why the U.S. economy uses more than one million pounds of materials per person each year! We will explore these ideas in more depth in the next chapter on industrial ecology.
A Natural Resource Taxonomy
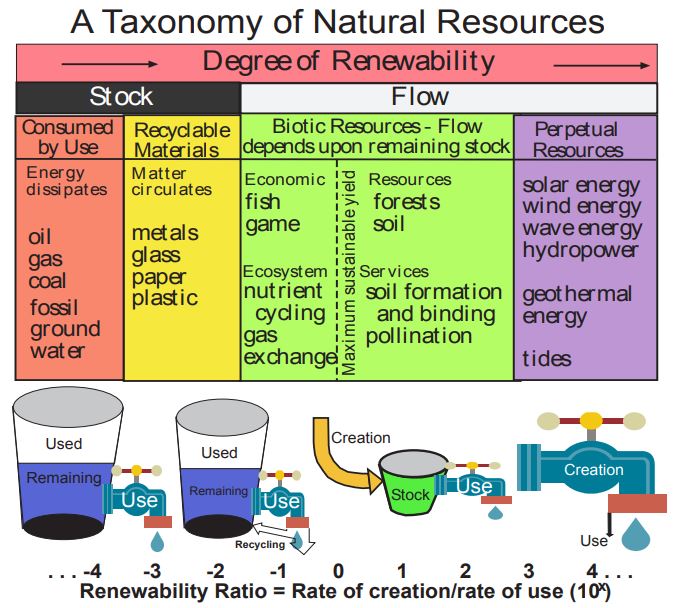
Now that we have an overarching concept of sustainability, let’s focus on individual natural resources. You have probably heard of stock or nonrenewable resources in contrast to flow or renewable resources, but let’s dig a little deeper into the meaning of these terms. All natural resources are created by a geologic (e.g., minerals), ecologic (e.g., forests), or astronomical (e.g., solar energy) process at a certain rate. All resources are utilized in a manner that may or may not consume them. For example, fossil fuels are burned away when they are used, but we don’t use up water when we float a boat on it.
Let’s start with stock resources like the fossil fuels (oil, gas, and coal) the formation of which we studied in Chapter 3 (Figure 7.6). These represent stored chemical energy from millions of years of photosynthesis, chemically transformed into hydrocarbons ready to burn to produce heat. This heat and the by-products of water and carbon dioxide (plus other pollutants) dissipate into the surrounding atmosphere. These resources are therefore “consumed by use.” They are a non-renewable stock, like a bank account with no interest and infinitesimal deposits, reflecting the slow rate of the geological process that create them. In contrast, humans are burning up fossil fuels accumulated over millions of years at rates a thousand to a million times faster than they are renewed in the Earth’s crust. They therefore have a renewability ratio (rate of creation/rate of use) with a denominator several orders of magnitude greater than the numerator. The exponent on the renewability ratio is shown on the bottom of Figure 7.6 (-4, for example, means that the rate of creation is 1/10,000 the rate of use). To put it simply, there is a fixed bucket of resources with a spout draining it (as shown in the bottom panel of Figure 7.6 below consumed by use resources), though abundant resources like coal have a bigger bucket than more scarce resources like oil or gas.
Metallic ores, such as bauxite that is refined into aluminum, are also created by geologic processes so slow that we can think of the supply as fixed. In this case, however, the materials, the aluminum atoms in this example, are not destroyed through use and can be recycled and used again and again. We have to think about how entropy and energy affect this process. The purest, lowest entropy, least cost ores are mined first and made into products that are part aluminum and part other materials and are then dispersed throughout the world. Then the second-best ores are mined and so on, keeping in mind that the lower the percentage of pure aluminum in the bauxite, the more energy it takes to refine it.
Over time, the quality of available ore declines, but more and more aluminum is lurking above ground in obsolete products available for recycling. We can think of the quality of accumulated aluminum in terms of how much energy it takes to gather, separate, and process it, just like ores. Over time, the stock of aluminum for recycling improves while the remaining stock for mining declines. Because of this, recycling constitutes a higher and higher proportion of raw materials used in new products. Other materials like glass (from abundant silicon) and plastic (from petroleum) follow a similar logic where virgin raw materials compete with recycled materials for the least-cost sources. We can never recycle 100 percent of a material, however, because human use disperses some of it irretrievably. Designing products so they can be easily dismantled and their various components recycled is a principle of industrial ecology as we will see in the next chapter.
Let’s jump to the purple column on the right-hand side of Figure 7.6. Some sources of energy just keep on coming. Solar energy is first on the list, but geothermal sources of heat and the gravitational forces that produce tides are also perpetual. There is no fixed bucket of resources but a faucet that will also keep flowing, though at variable rates, and whatever we don’t use just goes down the drain. The rate of creation of these resources is orders of magnitude higher than the rate of use (see exponents on the bottom of Figure 7.6), generating a renewability ratio in the hundreds, thousands, or even millions. Moreover, no matter how much we utilize the resource in the present, we can’t decrease the future supply of the resource. For these reasons, these types of resources, especially those derived from solar energy either directly (e.g., solar panels) or indirectly (e.g., wind, waves, hydropower), have become the icons of natural resources sustainability. As we will see in Chapter 14 on energy, however, it’s not that easy because it can be economically, and sometimes ecologically, challenging to capture these dispersed perpetual energy flows.
While at first it may appear that the most difficult issues of natural resources sustainability lie with the red consumed by use column, in fact it is in the green biotic resources column where our greatest challenges lie. These are flow or renewable resources, but they are fundamentally different from perpetual resources because they are created by ecological processes, starting with photosynthesis because of its foundational role in ecological productivity. As we saw in Chapter 4, less than 0.1 percent of solar energy is captured by photosynthesis. Solar energy flows out of a fire hose while biotic resources drip from a leaky faucet. Moreover, solar and geothermal energy flows occur due to basic physical processes that humans have little impact upon, while biotic resources depend upon viable ecosystems that humans have an enormous impact upon.
Take fish and game. These animals occupy specific ecological niches at the second or third trophic level, rely upon ecological relationships with prey and other species for their survival, have sometimes quite specific habitat requirements for successful reproduction, and a parent population must be preserved if the resource is to be sustained. Each of the HIPPO factors (Habitat destruction, Invasive species, Pollution, Population, and Overharvesting) discussed in Chapter 4 can decimate the resource. Forests are also vulnerable to each of the HIPPO factors.
While renewable, fish, game, and timber are provisioning ecosystem services that are consumed when used. The natural capital of soil can likewise be depreciated, such as by exposure to erosion. Here is where the renewability ratio becomes most critical. Flow resources have smaller, more temporary reservoirs of resources—fish in the water, game in the field, standing timber in the forest, soil on the ground—that need to be constantly, or at least frequently, replenished. They are more like a checking account than a savings account. If they are not to be overdrawn, the rate of use must not exceed the rate of creation. The renewability ratio must exceed one (that is, the exponent x on 10 in Figure 7.6 must exceed 0). Using a renewable resource at a renewability ratio of 1 is called maximum sustainable yield; it is the highest rate at which fish can be caught, game hunted, timber cut, soil eroded, and groundwater pumped without depleting the stock over time and overdrawing the checking account. It’s a solid concept for sustainable management of renewable resources, but we’ll see later that other factors come into play, especially the variable rate at which biotic resources are created and occasionally destroyed.
Supporting, regulatory, and cultural ecosystem services are not necessarily consumed when they are used (as we will explore in depth in Chapter 9), but instead depend upon viable ecosystems as an endowment of natural capital from which these services flow, like interest from the checking account. The unsustainable consumption of biotic resources or the degradation of ecosystems by other means therefore depreciates the natural capital endowment. This in turn diminishes the ecosystem service interest received. For this reason, natural resource sustainability is not just about having enough extractable resources like timber and fish in the future; it is more fundamentally about maintaining ecosystems and the host of services they generate—supporting, regulatory, and cultural, as well as provisioning.
Rather than an oxymoron, ecological economics proves to be the most important lens through which we gain an understanding and a definition of natural resource sustainability. With its key concepts in place, we can now explore another apparent oxymoron—industrial ecology.
Further Reading
Costanza, Robert, Ralph d’Arge, Rudolph. deGroot, Stephan Farber, Monica Grasso, Bruce Hannon, Karin Limburg, Shahid Naeem, Rovert V. O’Neill, Jose Paruelo, Robert G. Raskin, Paul Sutton, and Marjan van den Belt. 1997. The value of the world’s ecosystem services and natural capital. Nature 387(6630): 253–60.
Daily, Gretchen C. (ed). 1997. Nature’s services: societal dependence on natural ecosystems. Washington, DC: Island Press.
Daly, Herman E. and Joshua Farley. 2004. Ecological Economics: Principles and Applications. Island Press: Washington, DC.
Media Attributions |
|
