4 Chapter 4: Relevant Fundamentals of Ecology
Ecology is the study of the interactions among plants, animals, microbes, and the physical environments they inhabit. It is a relatively new science—the term was first used in 1935 and the first text was written in 1953—but over the last several decades, a core understanding of ecological processes and structure has emerged that we can call ecological theory. In this chapter, we will explore some critical elements of ecological theory that are very relevant in the analysis of natural resources sustainability. The first of these elements is the ecological process, focusing on energy and trophic structures, ecological niches, and nutrient cycling. The second element is geographical—identifying the major ecosystem types or biomes and where they occur on Earth. The third element is the study of ecological change over time, focusing on succession and disturbance.
With these concepts in hand, we’ll take an ecologist’s look at humans as a dominant species in the contemporary Earth ecosystem. We’ll conclude with an exploration of the Millennium Ecosystem Assessment and the more recent Policy Platform on Biodiversity and Ecosystem Services, seminal global studies by the United Nations that tell us how ecosystems are faring in a rapidly changing world. Is a global ecological collapse imminent? Or is there nothing to worry about? Clearly the answers lie in the vast gray zone between these extremes in the realms of ecological degradation and biodiversity loss.
The Ecological Process: Energy and Trophic Structures, Niches, and Nutrient Cycling
The Odum brothers, Eugene and Howard, both American ecologists, made perhaps the single most important contribution to ecological science in the 1950s and 60s when they came to understand that an ecosystem is designed to process energy. How does this occur? It all starts with the sun, of course, where, as a typical star, fusion generates helium from hydrogen. This releases huge quantities of nuclear energy that radiate through space at wavelengths centered on what we see as visible light but extending well into the ultraviolet (shorter wavelengths) and infrared (longer wavelengths) ranges. At a distance from the sun averaging 93 million miles with a diameter of 7,926 miles, the Earth intercepts about one-half of one billionth of this solar energy. A considerable portion of solar radiation is reflected away by clouds, ice and snow, and other light-colored surfaces (this is called albedo), but the majority strikes the Earth or ocean surface and is absorbed, thus warming the Earth.
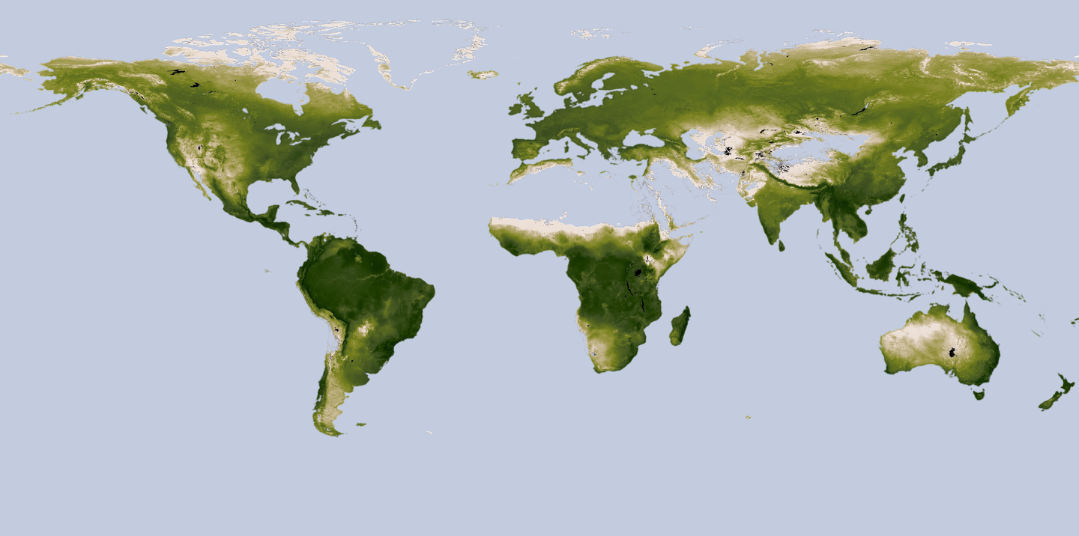
About a billion years ago, single-celled organisms known as algae evolved the capacity to use this solar energy, especially in the blue and red color ranges (not green, which they reflect and we see), to convert twelve common, low-energy, simple molecules—six of water (H2O) and six of carbon dioxide (CO2)—into a single, energy-packed molecule of carbohydrate or sugar (C6H12O6) plus six molecules of oxygen gas (O2). (Confirm to yourself that all the carbon, oxygen, and hydrogen atoms are accounted for in this chemical reaction). Photosynthesis was thus born in the chloroplasts of plant cells and with it an ecological energy source derived from plants termed primary producers. The total amount of photosynthesis accomplished by an ecosystem is called gross primary production. Ecologists measure the vibrancy of an ecosystem as net primary production—the photosynthetic energy fixed in carbohydrates and other biomass that remains on an annual basis after taking care of their own energy needs through respiration. Figure 4.1 shows a global map of terrestrial net primary production highlighting the central role of tropical forests and wetlands in the biosphere and the marginal role of polar regions and deserts. This is a map of how much life activity there is on various parts of Earth’s land surface.
Photosynthesis accomplishes many things and can be thought of as the heartbeat of the biosphere. It produces oxygen gas as a byproduct. This constitutes 20.9 percent of the Earth’s atmosphere and is the means through which nearly all living things capture energy from carbohydrates by eating and then burning them in the reverse process known as respiration (this occurs in the mitochondria of our cells). Photosynthesis removes carbon dioxide from the atmosphere and stores it as biomass (living tissue, much of which occurs in trees) and also funnels carbon into the soil as organic matter (i.e., humus) when biomass decays. The chemical energy contained in carbohydrates (i.e., calories) is available to animals as food. Together with oxygen, we can see that animals, including humans, are utterly dependent on plant photosynthesis for their survival.
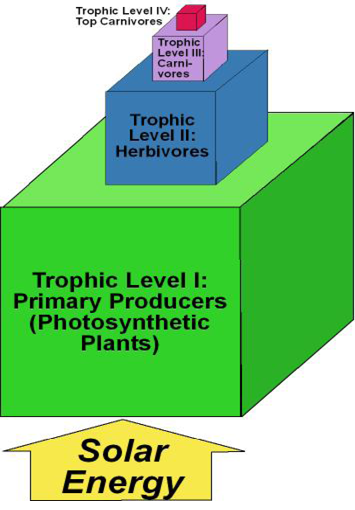
The Odum brothers conceived of this transfer of energy from plants to animals as trophic levels, with plants as the first trophic level. Herbivores and decomposers that eat the plants are thus the second trophic level, carnivores the third, and a carnivore that eats carnivores is at the fourth level.
Energy rarely gets past the fourth level because it is lost along the way through respiration that plants, animals, and microbes use for their own needs. As a rule of thumb, each trophic level uses 90 percent of the energy it captures as its own energy supply and only passes on 10 percent to the next higher level (Figure 4.2). For this reason, plants, not animals, make up the vast majority of biomass on Earth and are appropriately the primary basis for characterizing ecosystems. For the same reason, carnivores are generally only one-tenth as common as herbivores, and few animals can survive solely by eating other carnivores. By the fourth trophic level, ecological energy has largely dissipated. It is important to recognize that about ten times more humans can live as herbivores (i.e., vegetarians) than as strict carnivores. This is a relevant issue in natural resources sustainability for a species like humans that is an omnivore.
In any given ecosystem, these trophic levels make up the food chain, but where multiple species are present at each level, we have a food web. Food webs also include the detritus cycle—the decay of dead biomass, mostly plants, that is performed largely by fungi and bacteria, to a considerable extent in the soil and at the bottom of water environments. Square one in understanding any ecosystem is to get a handle on the food web and square one in understanding any species’ ecological niche is to see where it fits in that food web, keeping in mind that food is largely about capturing chemical energy originating from the sun. In addition to its food supply, and how it in turn is consumed, a species’ niche also includes its habitat—the climates it is best adapted to; whether it thrives on land, water, or both; whether it prefers forested, grassland, or other environments; and what circumstances are required for successful reproduction. What other species does it need to avoid and what species does it depend upon? Do events like floods and fires enhance its habitat or destroy it? We discussed the human ecological niche in Chapter 2 in comparison to that of oak trees, smallmouth bass, and the malaria virus. What is the niche of species we commonly experience: plants such as bluegrass, cattails, pine trees, and corn, vertebrate animals such as horses, deer, squirrels, and Canadian geese, invertebrates such as earthworms, crayfish, and grasshoppers, fungi such as mushrooms?
Ecosystems of the Earth: Biomes and Landscape Ecology
Geography and ecology meet in the categorization and mapping of the major ecological types on Earth called biomes. While there is no one universally accepted taxonomy (i.e., categorization system), it is fruitful to take a look at the factors that we can use to make important distinctions among ecosystems. The most fundamental division, of course, is between land and water—with wetlands intermediate between the two. Among water-based ecosystems, we make our next cut between salt and fresh water—with estuaries intermediate. Table 4.1 shows further divisions, such as between lakes and streams/rivers in the aquatic category and deep ocean, shallow and more productive continental shelves, and coastal ecosystems under the marine umbrella. We can continue to make distinctions almost indefinitely, but for our purposes it is sufficient to stop at this point.
Table 4.1. An example of a simple taxonomy of ecosystem types.
The Biosphere
- Water and wetlands
- Salt water/marine
- Deep Ocean
- Continental Shelf
- Coastal/Wetland
- Mangroves
- Estuaries
- Fresh water/aquatic
- Lakes
- Streams and rivers
- Wetlands
- Marshes
- Swamps
- Salt water/marine
- Terrestrial
- Forested
- Tropical
- Temperate
- Boreal
- Water-limited
- Grassland
- Savanna
- Prairie/steppe
- Woodland/shrubland
- Arid
- Semiarid scrubland
- Desert
- Grassland
- Cold-limited
- Forested
For land-based ecosystems, plant life is the key. Because they are primary producers and thus the first tropic level, about 90 percent of biomass in an ecosystem is plants. These form both the energy source and the habitat for higher, animal-based trophic levels. From this starting point, there are a number of ways to proceed. In Table 4.1, the next cut is made by acknowledging that wherever land has sufficient warmth and precipitation, a forest will grow (i.e., unless it is removed by fire, chain saws, or the plow). Climate is therefore critical to ecology and plays a large role in defining biomes. Forests can then be divided simply into tropical, temperate, and subarctic zones, the latter known as taiga or boreal forest. A second important distinction among forests is whether they are deciduous (the leaves fall in winter or the dry season) or evergreen, and whether they are broad leaf, like an oak or maple, or needle leaf, like a pine or fir.
Where rainfall is insufficient or fire too frequent for forests, we will find grasslands known as savanna in the tropics, prairie or steppe in the temperate zone. In lands with a Mediterranean climate (winters are wet, summers are dry), we may also find shrublands, often dominated by fire-prone oak shrub, sometimes referred to as chaparral. As precipitation declines even further, grasslands and shrublands give way to semiarid scrub such as interspersed sagebrush that dominates much of the American West, until these give way to a landscape largely devoid of vegetation—the true desert.
Where cold temperatures and short growing seasons prevent forests from growing, we find the shrub/grass/wetland mix known as tundra, except where glacial ice prevents all plant growth in most of Antarctica and Greenland. In mountains, alpine ecosystems place several of these ecotypes in close proximity based on elevation—with higher elevations resembling more polar climates—and, to a lesser extent, aspect—slopes facing the equator are warmer and dryer than slopes facing away because they receive more sunlight.
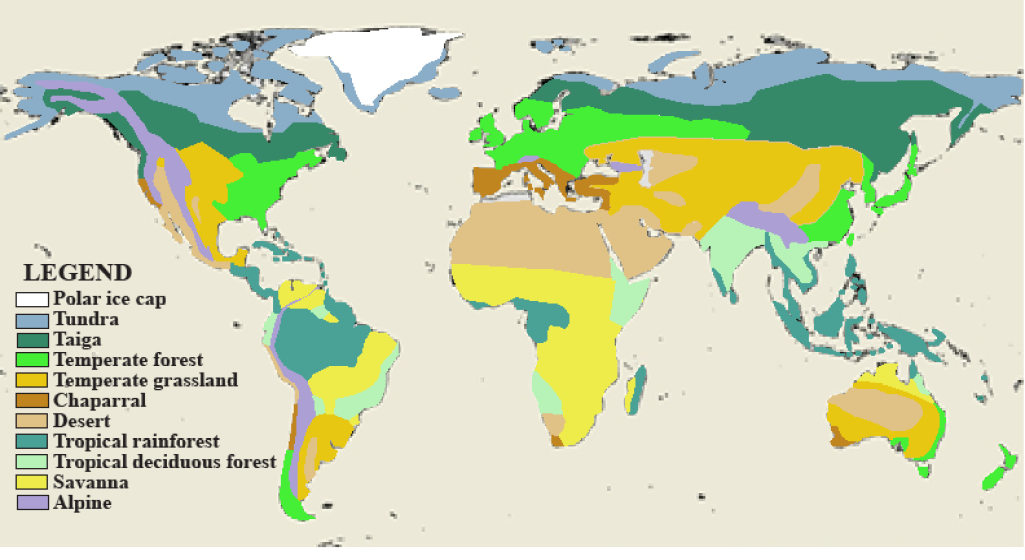
So where on Earth do these biomes occur? Take a good look at the simple map in Figure 4.3 and let’s take some time to point a few things out. It’s no surprise that tropical rainforests straddle the equator in South America (the Amazon), Africa (the Congo), and southeast Asia, including the islands of Indonesia and the Philippines. These are surrounded by tropical seasonal forests that drop their leaves in the dry season (generally each hemisphere’s winter, though in the tropics, of course, it doesn’t get very cold) and by savannas, where interspersed trees provide shade for grazers and the predators that chase them.
Temperate deciduous forest is my “home” ecosystem – both where I grew up in upstate New York and where I taught for 26 years in southern Illinois where the corn fields end. You may have a different “home” ecosystem. It also occurs in much of Europe and northeast Asia, including Japan. An evergreen temperate rainforest occurs along the beautiful Pacific Northwest coast from northern California to Alaska and in New Zealand. Spruce and fir evergreen taiga is dominant in the subarctic zone of Canada and Russia.
Temperate grasslands epitomize the American Great Plains but also the interior of Asia, grading through scrubland into desert where rainfall is most stingy or centuries of overgrazing have degraded the soil. Bone-dry, rocky, or sandy subtropical deserts straddle the Tropic of Cancer, especially in North Africa and the Arabian Peninsula—the world’s super desert known as the Sahara—more than in North America along the U.S.-Mexican border. The Australian outback, straddling the Tropic of Capricorn, is also a subtropical desert. Woodland/shrubland surrounds the Mediterranean and characterizes southern California. Tundra dominates the Arctic in both North America and Siberia while complex alpine zones are most evident in the Himalayas, Andes, and Rocky Mountain chains, though they occur elsewhere as well.
Through this examination of biomes, we can see that there is a chain of causation that runs from latitude, through climate, to dominant vegetation, to animal life. In any one place, however, other factors such as proximity to the sea, topography, soil, biological history, and, of course, human occupation also come into play in generating the complex geography of ecosystems across the globe.
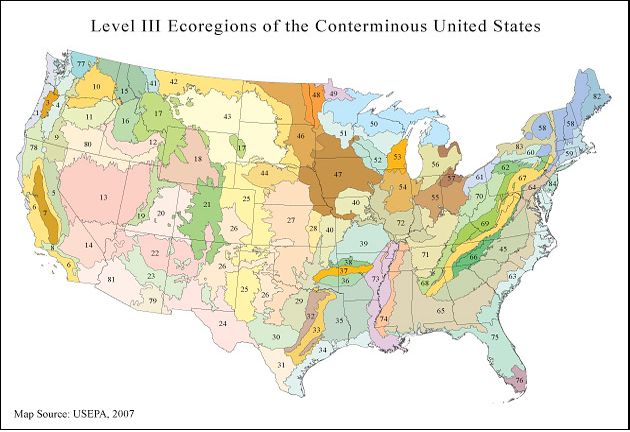
The map in Figure 4.3 paints with a spray can, but it’s also important to take a closer look, so let’s break out the paint brushes. With a broad brush, we can identify ecoregions based on constellations of climate, topography, and vegetation, which often coalesce in determining a characteristic land use. Because there is no completely objective way to delineate ecosystems—or for that manner to draw lines between biomes—maps of ecoregions differ. The one I’ve found most useful is James Omernik’s (1987) Ecoregions of the U.S. which has been adopted by the U.S. Environmental Protection agency. Take a look at Figure 4.4 and find the ecoregion(s) you grew up in, the one where you are obtaining your education, and places you have traveled frequently on outdoor-oriented vacation trips. What characterizes these places in terms of climate, topography, vegetation, and land use? Are the areas delineated in the map more similar within the boundary of an ecoregion than they are outside of it? Would you place the boundary somewhere else or redefine an ecoregion?
| 1. | Coast Range | 29. | Cross Timbers | 57. | Cross Timbers |
| 2. | Puget Lowland | 30. | Edwards Plateau | 58. | Edwards Plateau |
| 3. | Willamette Valley | 31. | Southern Texas Plains | 59. | Southern Texas Plains |
| 4. | Cascades | 32. | Texas Blackland Prairies | 60. | Texas Blackland Prairies |
| 5. | Sierra Nevada | 33. | East Central Texas Plains | 61. | East Central Texas Plains |
| 6. | Southern and Central California Chaparral and Oak Woodlands | 34. | Western Gulf Coastal Plain | 62. | Western Gulf Coastal Plain |
| 7. | Central California Valley | 35. | South Central Plains | 63. | South Central Plains |
| 8. | Southern California Mountains | 36. | Ouachita Mountains | 64. | Ouachita Mountains |
| 9. | Eastern Cascades Slopes and Foothills | 37. | Arkansas Valley | 65. | Arkansas Valley |
| 10. | Columbia Plateau | 38. | Boston Mountains | 66. | Boston Mountains |
| 11. | Blue Mountains | 39. | Ozark Highlands | 67. | Ozark Highlands |
| 12. | Snake River Plain | 40. | Central Irregular Plains | 68. | Central Irregular Plains |
| 13. | Central Basin and Range | 41. | Canadian Rockies | 69. | Canadian Rockies |
| 14. | Mojave Basin and Range | 42. | Northwestern Glaciated Plains | 70. | Northwestern Glaciated Plains |
| 15. | Northern Rockies | 43. | Northwestern Great Plains | 71. | Northwestern Great Plains |
| 16. | Idaho Batholith | 44. | Nebraska Sand Hills | 72. | Nebraska Sand Hills |
| 17. | Middle Rockies | 45. | Piedmont | 73. | Piedmont |
| 18. | Wyoming Basin | 46. | Northern Glaciated Plains | 74. | Northern Glaciated Plains |
| 19. | Wasatch and Uinta Mountains | 47. | Western Corn Belt Plains | 75. | Western Corn Belt Plains |
| 20. | Colorado Plateaus | 48. | Lake Agassiz Plain | 76. | Lake Agassiz Plain |
| 21. | Southern Rockies | 49. | Northern Minnesota Wetlands | 77. | Northern Minnesota Wetlands |
| 22. | Arizona/New Mexico Plateau | 50. | Northern Lakes and Forests | 78. | Northern Lakes and Forests |
| 23. | Arizona/New Mexico Mountains | 51. | North Central Hardwood Forests | 79. | North Central Hardwood Forests |
| 24. | Chihuahuan Deserts | 52. | Driftless Area | 80. | Driftless Area |
| 25. | High Plains | 53. | Southeastern Wisconsin Till Plains | 81. | Southeastern Wisconsin Till Plains |
| 26. | Southwestern Tablelands | 54. | Central Corn Belt Plains | 82. | Central Corn Belt Plains |
| 27. | Central Great Plains | 55. | Eastern Corn Belt Plains | 83. | Eastern Corn Belt Plains |
| 28. | Flint Hills | 56. | Southern Michigan/Northern Indiana Drift Plains | 84. | Southern Michigan/Northern Indiana Drift Plains |
Now let’s get out the finer paint brush and take a look at landscape ecology at the scale we would see from an airplane window. You will likely see a dominant land use that covers the majority of the landscape—forest, grassland, cropland, or desert most likely. This is called the landscape mosaic. Within that, there will be patches of something else—wetlands, towns, industrial areas, lakes —and linear corridors—roads, rivers. These components of the landscape interact with one another and their spatial arrangement or layout is important. What serves as a corridor for easy movement to one species (e.g., roads for humans, rivers for fish) is a barrier for others (e.g., turtles, bobcats). Some species thrive at the edge of ecosystems. Deer hide in the woods and wetlands but browse in the fields. Others prefer the interior like owls and woodpeckers in a forest. Wet areas along a river valley, the riparian zone, are critical habitats in arid regions because this is where vegetation grows far more productively. Riparian zones are also important in humid climates because this is where flood waters spill over the riverbank depositing sediment and seeds and exchanging nutrients and species.
Biologists are interested in ever-smaller scales, from plots of a few yards square where they may find plants, invertebrate animals, fungi, and microorganisms tangled together in relationships that are often mutualistic (benefiting both parties) to the individual plant or animal organism with its interdependent organs and systems, down to its cells, DNA, and molecules. For the purposes of understanding natural resource sustainability, however, we’ll stop here, but I hope you see fit to study ecology and biology at these smaller scales.
Ecological Change: Succession and Disturbance
Ecosystems vary geographically, but they also have a history. It is revealing to dip into the debates among ecologists focused on temporal dynamics because it tells us something about the ever-changing nature of ecological reality. “Succession” is a century-old idea first authored by Frederic Clements. It is increasingly in disfavor, but let’s take a look at what many ecologists have taken pride in shooting down.
A pioneer farmer in the Ohio Valley clears a forest to plow the field for crops. A generation later, the farm is proving to be unprofitable and so (s)he stops plowing it and moves on. What happens now? Some plants specialize in spreading their seeds so they can quickly and opportunistically colonize a newly available niche, which open soil that receives rain and sunlight clearly represents. We call them “weeds,” but they are simply fast, colonizing plants, many of which have positive characteristics. In this abandoned field, the weeds hold the soil and maintain the flow of carbon and nitrogen, thus setting the stage for fast-growing woody plants like cottonwood or poplar that also distribute seeds in the wind, looking for a new home. These eventually outgrow the “weedy” grasses and forbs and form a dense stand. Next come the oaks and hickories that use nutrients, water, and sunlight more effectively and are thus able to outgrow the cottonwoods and poplar over time. These tree species are shade-intolerant, however, so their own saplings are not viable in the shade of their parents. More shade-tolerant maples and beeches thus succeed oaks and hickories over the course of a few centuries. Clements called this a climax forest because no other plant species would succeed maple-beech. He thought that the ecosystem had reached equilibrium.
In a quiet world without fire, floods, climatic extremes, storms—and humans—Clements was largely correct, but we don’t live in that world. We live in a world of ecological disturbances, and they generally come more frequently than the time it takes to reach the “climax” state. So rather than ask “what is the climax state and what stage are we in the progression toward it?” ecologists are now asking “what is the disturbance regime and how does the ecosystem adapt to it?” Fire is a mainstay of chaparral, grassland, and drier forests dominated by oaks, pines, or aspen. Floods are a mainstay of wetlands, moister forests in riparian zones, and wadis or arroyos (usually dry riverbeds in the desert that explode with water when it finally does rain). Storms less severe than hurricanes can knock forests flat. On May 8, 2009, a super-derecho, or straight-line winds, knocked down so many trees, including 20 in my yard, including four 100-foot oaks, that my home county received federal disaster assistance. A herd of bison or a swarm of tent caterpillars can eat up every green blade or leaf in sight. And then come humans with chain saws, matches, plows, herbicides, even concrete, and a changing climate.
With all of these disturbances, ecosystems rarely reach Clement’s imagined climax equilibrium. Instead, we have ecosystems in various stages of recovery from past disturbances of different forms and intensities. That’s not all bad, because they can often have a rejuvenating effect, creating niches, mobilizing nutrients, restoring the opportunity for growth. When is a fire or a flood good? When is it bad? It’s not an easy question to answer. Nevertheless, an understanding of the disturbance regime is now considered to be central to an understanding of any ecosystem.
Biodiversity and its Loss
It is difficult to fathom the diversity of life on Earth. Microbes live a mile deep in the Earth’s crust, in pressurized water hotter than the boiling point, and in the dry valleys of Antarctic— wherever more than a few molecules of liquid water accumulate, even occasionally.
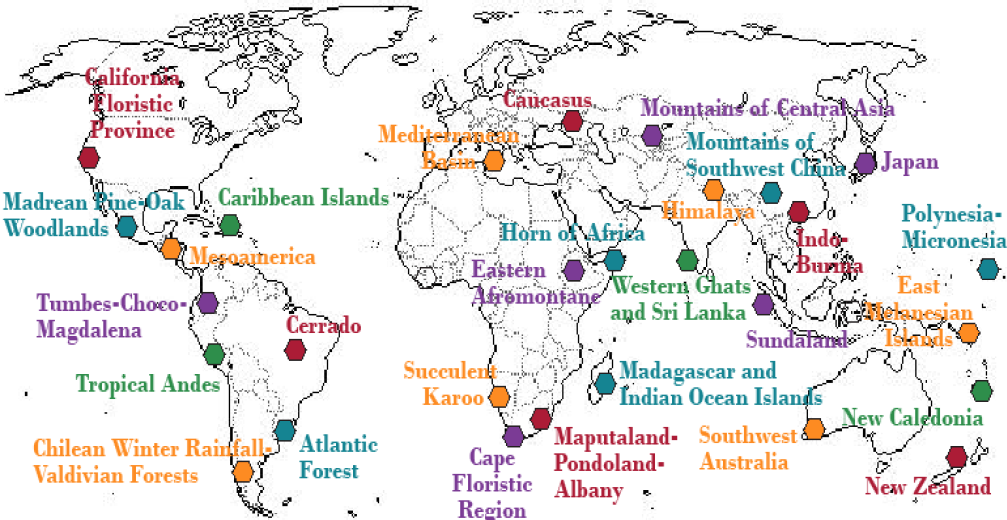
Thirty-five “hotspots” of biological diversity together cover only 1.4 percent of the world’s land surface but contain nearly half of plant and over a third of animal species (Figure 4.5). In these special places, new species are being discovered at astonishing rates. Eminent Harvard biologist Edward O. Wilson in The Future of Life describes how he has discovered dozens of new species of insects in a single day from a single tropical tree but that other biological explorers have surpassed even his accomplishments. Science has clearly identified 1.5–1.8 million species, 205,000 of these in the United States, but estimates of how many there really are vary from 3 to 100 million! New mammal and even new primate species continue to turn up once trained scientists start an intensive search. Unfortunately, this cornucopia of biodiversity is eroding away like soil exposed to the rain and the wind.
According to E. O. Wilson, the Earth is today going through a great extinction, if far less suddenly than when a meteor strike on the Yucatan Peninsula of Mexico wiped out the dinosaurs 65 million years ago. For example, the declining amphibian phenomenon (more popularly, the frog die-off) has resulted in the loss of half the Earth’s population of amphibians in the last 35 years. We are losing species at 100–1,000 times the average rate that has occurred over the past several million years. This is a biodiversity crisis. Many problems of natural resource sustainability are reversible—soils can be restored, forests regrown—or substitutable —wind energy can replace depleted oil supplies. But extinction is forever. Why is this happening?
Biological conservationists use a simple acronym—HIPPO—to summarize the drivers of biodiversity loss: Habitat destruction, Invasive species, Pollution, Population, and Overharvesting. They are all results of human actions on a planet where humans have become the dominant species and an irresistible ecological force. In order to further explore the HIPPO factors, let us now turn to the seminal 2005 study known as the Millennium Ecosystem Assessment and its 2019 successor, the Policy Platform on Biodiversity and Ecosystem Services (PPBES).
The Millennium Ecosystem Assessment and the Policy Platform on Biodiversity and Ecosystem Services
In 2000 Secretary-General of the United Nations Kofi Annan called for a “millennium ecosystem assessment,” a study of the ecological state of the world with a focus on how ecological changes affect human well-being, the causes or drivers of those ecological changes, and remedies that may lie in the realm of policy and changes in human behavior. The resulting assessment published in 2005 was the most intensive and rigorous worldwide study of the interactions between humans and nature ever conducted. It involved over 2,000 scientists and researchers from nearly every country who published dozens of separate studies totaling several thousand pages. Fortunately, the Millennium Ecosystem Assessment has been condensed into shorter and more accessible forms, including a 28-page message from the board titled Living Beyond Our Means: Natural Assets and Human Well-being and a 155-page synthesis report containing a 24-page executive summary. These distillations of a study that rivals the Nobel Peace prize-winning Intergovernmental Panel on Climate Change reports in quality and scope can be downloaded free on the Millennium Ecosystem Assessment website. As of this writing, the successor study called the Policy Platform on Biodiversity and Ecosystem Services has released a Summary for Policymakers and a summary paper was published in the prestigious journal Science in December 2019. We eagerly await the main body of this foundational report.
How do ecosystems affect human well-being? The first human need is for the basic material elements of survival—oxygen from the air, clean water, food, shelter—all of which are derived almost entirely from ecosystems. The second need is for security from harm. While we may need police and defense establishments to protect us from other humans that wish to do us harm, ecosystems also provide a buffer from nature’s extremes—floods and droughts, hurricanes, and tsunamis. Ecosystems are also a psychological resource providing beauty, comfort, places to explore, and fun things to do on weekends and summer vacations, even a haven of spiritual enrichment.
In recognition of these connections, the two U.N. studies adopt ecosystem services as a point of departure in assessing how ecosystems are faring. These come in four conceptually distinct forms: provisioning, cultural, regulatory, and supporting. Provisioning ecosystem services meet human needs through use or consumption of natural resources such as food, fresh water, raw materials, energy supplies, and so forth. Commonly these services are bought and sold as components of the market economy, though there are many exceptions such as the gathering of fuel wood, subsistence and recreational hunting, fishing, and farming.
Cultural ecosystem services are experiential. Whenever we escape from our offices, classrooms, and homes filled with digital media and experience the genuine analog world around us, even through a car’s windshield, we are being provided with cultural services from ecosystems. Gardening, fishing, hunting, and hiking are activities that account for most of the time Americans spend outdoors – and three of the four can potentially produce food, though this is rarely why we do these things. More likely, it makes us happy and provides some much-needed exercise. Reverence for a sacred place, the challenge of climbing a mountain or running a rapid river, or the experience of wilderness take cultural ecosystem services to a deeper psychological level in the subjective world where beauty is in the eye of the beholder and to each his own. Ecotourism, a term that includes everything from safaris to the Serengeti Plain to guided fly-fishing trips and nature documentaries are examples where these experiences are purchased from outfitters or the media, but the majority of cultural ecosystem service experiences are not directly sold. For many, the absence of buyers and sellers is a key to making the experience of nature authentic, yet the lodging, vehicles and equipment needed to facilitate these experiences is an enormous industry.
Regulating ecosystem services are a little less straight-forward and so are best explained through examples. Because atmospheric carbon absorbs long-wave radiation and therefore contributes to climate change, storing it in biomass (that is, as part of a plant, such as a tree) rather than in the atmosphere helps regulate the climate. Wetlands help remove nitrate pollution from water through denitrification and uptake of this fertilizer by plants. They also absorb flood waters in low-lying areas, river floodplains, and hurricane-prone coastlines. Wetlands thus provide the regulating services of water purification and flood control. Bees pollinate crops. Other insects and birds eat pests that destroy crops and spread disease. These examples of regulating services are rarely bought and sold—though that is beginning to change, as we will see in Chapter 15.
Supporting ecosystem services include everything we studied earlier in this chapter and in Chapter 3, from (yet again) photosynthesis to soil formation and the cycling of nutrients. They are the basic infrastructure and metabolism of the planet upon which everything else is based. While humans benefit more directly from provisioning, cultural, and regulating services, there would be none of these if it were not for the supporting services that nature provides free of charge and we all take for granted—until they start to disappear.
Now that we better understand how ecosystems service humans, how are they faring across this beautiful planet? The PPBES report provides four main conclusions that we will explore.
- Nature and its vital contributions to people, which together embody biodiversity and ecosystem functions and services, are deteriorating
-
worldwide.
Direct and indirect drivers of change have accelerated during the past 50 years.
- Goals for conserving and sustainably using nature and achieving sustainability cannot be met by current trajectories, and goals for 2030 and beyond can only be achieved through transformative changes across economic, social, political, and technological factors.
- Nature can be conserved, restored, and used sustainably while simultaneously meeting other global societal goals through urgent and concerted efforts fostering transformative change.
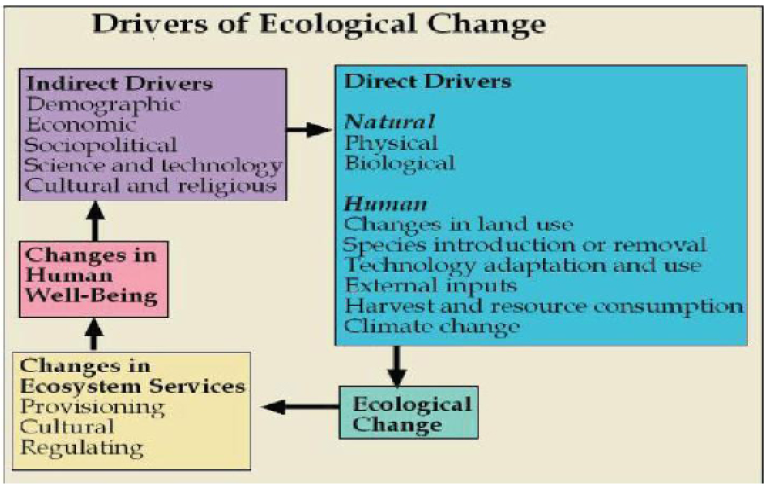
Ecological changes have human consequences because they change the quantity and quality of ecosystem services provided to specific people in specific places, thereby improving or diminishing their well-being. What is causing these often troubling and occasionally encouraging ecological changes? The causes are complex, but we can start by identifying the direct drivers and then work backwards to identify indirect drivers. Figure 4.6 will help us do that.
Direct Drivers
Ecosystems change due to natural causes falling in either the physical realm (e.g., earthquakes, hurricanes, meteor strikes) or the biological realm (e.g., the evolution of a viral or bacterial disease). They also change due to human causes such as habitat destruction.
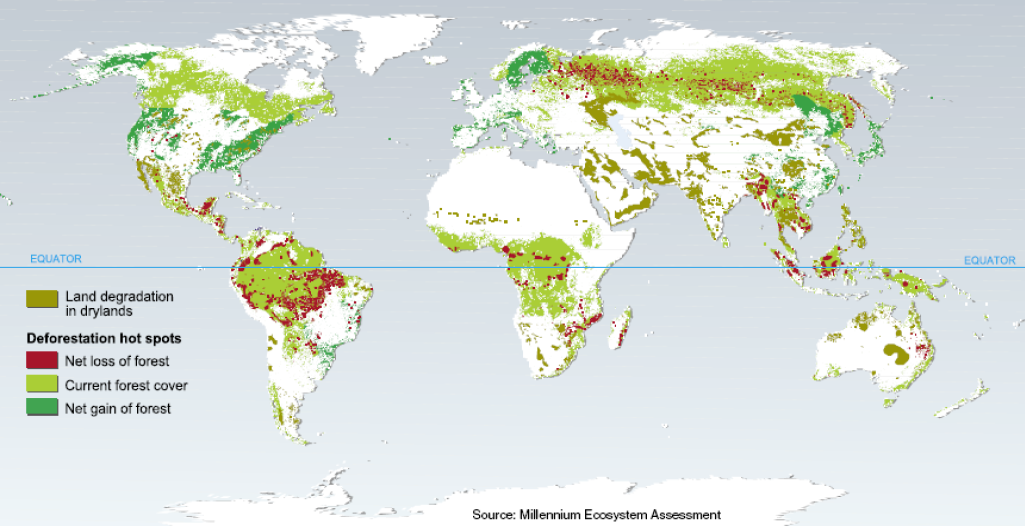
Land-use changes. Changes in land use, such as development of forested or agricultural areas for urban uses, the conversion of wetlands or forests into cropland or pasture, or their reversion back to wetland or forest, have profound effects on ecosystems and are identified by the PPBES as the most important driver of biodiversity loss. Figure 4.7 from the Millennium Ecosystem Assessment shows the areas of the Earth that have maintained forest cover over the period 1980–2000 in light green. A band of tropical forests straddling the equator in South America, Africa, and Southeast Asia is evident as well as a band of boreal forest (or taiga) especially in Canada and Russia. Net gains in forest area have occurred in parts of Europe, Japan, and the eastern United States, which is the global center of reforestation (dark green). Deforestation is rampant in the Brazilian Amazon, as you have no doubt heard, but also in Indonesia and other tropical countries as well as in Russia (dark red).
The map also shows where dry grasslands are being degraded, usually through livestock grazing, into more desert-like conditions in several localized areas of Asia, Australia, and near the U.S.-Mexico border (olive). In most instances, land uses are relatively stable, but where they are not, ecosystems are being altered radically. The questions arise: Why these directions of change? Why these places and not others?
Species introductions and removals. While more subtle than wholesale land-use change, species introductions and removals have ripple effects that can be difficult to predict. The accidental release of the zebra mussel from the Black or Caspian Sea into the Great Lakes resulted in a population explosion of these tiny shellfish that numbers in the trillions. In addition to being a very expensive nuisance on water intakes and other human structures, many native species of mussels are losing the ecological competition to this invasive species. The zebra mussel is a filter feeder, however, and their presence has improved water quality and clarity throughout the Great Lakes. Sight-feeding predator fish such as introduced Chinook salmon, brown and rainbow trout have benefited from the zebra mussel’s water-cleansing services, and therefore so have anglers and outfitters. Conversely, the removal of sea otters in the Pacific Northwest through over-hunting has led to a population explosion of their prey (sea urchins) that have subsequently devoured the undersea kelp forests, home to many species of fish. The kudzu vine, “the plant that ate the south,” can grow two inches in an hour to smother less exuberant plants. Fortunately, cattle can graze on it and it can be used to protect exposed soils, but other invasive species lack any silver lining. The chestnut fungus introduced on imports of Asian logs in 1904 completely wiped out the most important tree in the central hardwood forest of the eastern U.S. in the first half of the 20th century. The Asian subterranean termite causes billions of dollars of property damage in New Orleans and other southern cities. Asian carp now dominate the Mississippi River and many of its tributaries.
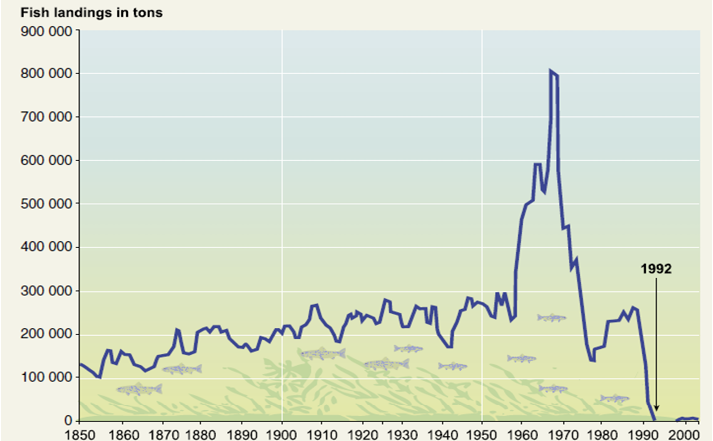
Technology. Human domination of the planet has been achieved in large measure through use of technologies, from chain saws to plows, through which humans can impose their will on how to use a parcel of land, to antibiotics and pesticides, chemicals that humans use to protect themselves and their food supplies from biological competitors. As these technologies are diffused from one society and one ecosystem to the next, and as they are adapted to changing circumstances, their ecological impacts also change. Repeatedly plowing the soil in Iowa can induce erosion; repeatedly plowing the soil in the Amazon can permanently destroy it. Perhaps you can think of other examples discussed elsewhere in this text where the introduction of a technology was as devastating as huge drag nets were to the North Atlantic cod fishery in the 1980s (Figure 4.8) or as helpful as the introduction of the disk used in conservation tillage to replace the moldboard plow.
External inputs. Rachel Carson’s 1960 classic Silent Spring, which helped launch the modern environmental movement, told the story of how the pesticide DDT was wreaking havoc on birds and other wildlife because it is both persistent (i.e., it doesn’t readily break down or biodegrade, so it stays in the environment for decades, even centuries) and bioaccumulative (this means that its concentration increases as it moves up the food web to toxic levels in carnivores). Nitrogen in the form of fertilizers is another critical external input that we explored in Chapter 3.
Ecological harvesting. When humans use natural resources for provisioning purposes, resources are usually extracted or harvested and subsequently consumed. Mining coal, metallic, and other ores, cutting timber, catching fish and game, harvesting crops, and sending livestock to the slaughterhouse, all have ecological effects. These include the effects caused by the game, fish, trees, crops, and livestock no longer being in the ecosystem, and the disturbances caused in the process of extraction. These disturbances include surface and underground mining, clear-cutting or selective harvest of timber, and road building. Figure 4.8 shows the stark example of the North Atlantic fisheries when record harvests of cod and haddock in the 1960s and 1970s caused the fishery to collapse. How is the marine ecosystem adapting to the loss of these key predator species?
Climate Change. Ecosystems are closely adapted to climates and when these change so do the ecosystems. Some species are favored by the higher temperatures, carbon dioxide concentrations, sea level rise, the changes in rainfall, or decreases in snow and ice that climate change brings. Some species are placed at a disadvantage, like the poor polar bear as their sea ice habitat melts away. Moreover, as the direct climatic effects play out, ecosystems end up with a different constellation of species, which causes further changes as they adapt to one another. For example, some species can readily migrate poleward to the climate they do best in, others can spread their seeds to new niches, while others are stuck in place to adapt or die out. Is there a migratory pathway they can take or is the next available habitat too far away to find and travel to?
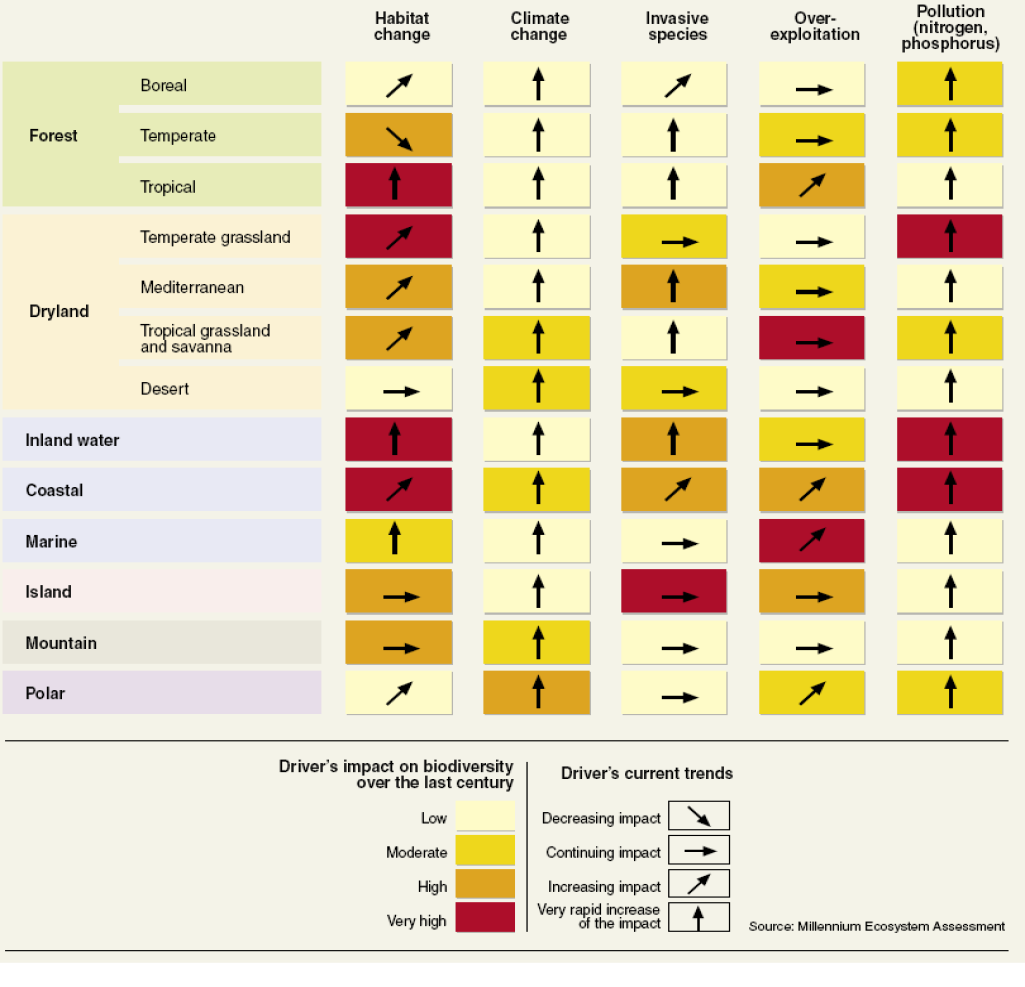
Figure 4.9 from the Millennium Ecosystem Assessment summarizes the effects of these direct drivers on each of the major ecosystem types. Note that only one arrow is pointed down—habitat change in temperate forests where forests in the eastern U.S., Europe, and Japan are improving. All the arrows are pointed up under climate change and pollution where rapidly increasing external inputs of atmospheric carbon as well as nitrogen and phosphorus from fertilizer are changing all ecosystems. These pollutants, especially nitrogen, have very high impacts on biodiversity in temperate grasslands (which are often farmed), and on inland (fresh) water and coastal ecosystems, to which much of the nitrogen is flushed through runoff.
Take a few minutes to go down each column (representing a specific driver) and across each row (representing a specific ecosystem type) and see if you can surmise why the colors (representing that driver’s impact on biodiversity in that ecosystem) and direction of arrows (representing the driver’s current trends) are shown the way they are. For example, why is the effect of invasive species on inland water ecosystems high and rapidly increasing? Think of the zebra mussel cited above.
Indirect Drivers
While we can point to these six and other direct drivers as the cause of ecosystem change, what in turn causes them? Indirect drivers fall squarely in the realm of social science. Let’s briefly identify them. In a world where the human population has grown from 2 to 7.8 billion in the last century, demographic (that is, population) changes are obviously at work. They are more than just a multiplier of the other drivers, however, as we will see in Chapter 5.
Economic growth and change is the irresistible force of all of the direct drivers, as we will explore in chapters 6 and 7. Sociopolitical change often occurs more slowly, then bursts forward when regimes change, such as fall of the Soviet Union in 1989–1991, the radical shift of China from communism to capitalism under Deng Xiaoping in the 1980s, and the expansion, then contraction, of the European Union over the past generation. Social movements, including the environmental movement—along with civil rights, women’s rights, gay rights, Islamic fundamentalism, and other movements—can take societies in a new direction.
Science and technology are so often lumped together that we forget that they play two separate roles in society. Science has taught us that we live in an unimaginably old, enormous, and complex universe that began with a big bang and that we evolved over millions of years on a 4.5- billion-year-old planet we share with millions of other species in communities called ecosystems. Technological advances, usually founded in science, have uniquely empowered humans within this community and will continue to do so as we perhaps learn how to do things like inexpensively desalinate seawater, safely store carbon emissions in the Earth, replicate the photosynthesis process outside of plants, cheaply capture solar energy for electricity, or develop vaccines for coronavirus outbreaks. Each of these advances, if and when achieved, will change our relationships in the ecological community—hopefully for the better but quite possibly for the worse.
Culture and religion help us work out the meaning of all this in terms of what we should care about, what’s right, what’s wrong, what we hope for, and what we fear. These things are different to different people, change over time, and even change for each of us as individuals as we grow.
This brief introduction to indirect drivers serves as our segue way to a discussion of society’s role in natural resource sustainability in Part IV.
Further Reading
Diaz et al. 2019. Global Conservation Summary Review: Pervasive human-driven decline of life on Earth points to the need for transformative change. Science 336: 1327.
Intergovernmental Science-Policy Platform on Biodiversity and Ecosystem Services, 2019. Summary for policymakers.
Millennium Ecosystem Assessment, 2005. Ecosystems and Human Well-Being: Synthesis (155pp).
Media Attributions |
|
