14 Chapter 14: Energy Sustainability
The subject of energy has always fascinated me. Not so much the physicist’s idea of forms of energy—electromagnetic, nuclear, mechanical, chemical, heat, and so forth—though that comes into the story, but energy as the lynchpin of what we know as modern industrial society and as a key element in natural resources sustainability.
Energy is a quintessentially interdisciplinary topic where technology, economics, and the environment come together in geographical space and historical time. We’ve known energy is a key sustainability issue since I was kid during the 1973 OPEC oil embargo, then called the “energy crisis,” that sent Americans into a panic. Back then, Americans responded to the energy challenge for a while, driving more fuel-efficient cars and foregoing oil as a fuel for electricity production, but as oil prices settled down and supplies seemed to again become reliable, we got complacent. The crisis seemed to go away, and car companies sold us minivans, pickup trucks, and SUVs to drive from our air-conditioned homes to our air-conditioned offices while the number of electrical appliances and electronic devices multiplied. Now, with climate change, we’re faced with a historic, long-term energy challenge. How will we meet it?

Figure 14.1 shows the world at night. What we see is essentially a map of electricity consumption, reflecting both population density and level of industrial development. Two centuries ago, the map would have been black. Some of it is still black, not only in uninhabited areas but in poor developing countries, especially in Africa, where most people do not have daily access to electricity.
In exploring the issue of energy, we first need to establish how we use energy to make our lives better. “Energy” is really an umbrella term for three sectors that are often nearly separate: (1) electricity, (2) fuels for vehicles, and (3) heating for buildings and industrial processes. To understand our current energy predicament, a sense of history is critical, and so also is knowledge of where we now stand, because that is where the journey into the energy future begins. So we’ll proceed from past to present to future in the fashion of Ebenezer Scrooge in A Christmas Carol.
The Ghost of Energy Past
The tiny population of primitive humans in East Africa 100,000 years ago had no more access to energy than any other animal—the sun to keep them warm and the calories in the food they ate. Fire (biomass energy, that is) made it possible for advanced hunters to inhabit cooler climates outside Africa and expand the range of edible foods, among other advantages (Table 14.1). Then came the domestication of draft animals like the ox and the horse in the Fertile Crescent, followed by the use of wind to push ships and pump water in the ancient world. Next came the use of falling water to drive mills in early modern times. Then it was back to fire again, but this time using the enormous storehouse of chemical energy from past photosynthesis in fossil fuels, and the industrial revolution was on. The human population has grown by a factor of perhaps 106 (a million) and each person uses perhaps 103 (a thousand) times as much energy as primitive humans, for a total human energy use today 109 (a billion) times as great as our East African forebearers were able to muster. Energy use is a key element in human’s rise to ecological dominance.
Table 14.1. Energy sources available to humans at different stages of technological development. The bottom shows the exponential growth in population, energy use per capita, and total energy use.
| Stage | ||||
| Energy source | Primitive humans | Advanced hunters | Agriculturalists | Modern industrial |
| Food | x | x | x | x |
| Fire | x | x | x | |
| Animals | x | x | ||
| Wind | x | x | ||
| Water | x | x | ||
| Fossil fuels | x | |||
| Population (10x) | 10 | 4 | 6 | 8 |
| Energy use/cap (10x) | 2 | 3 | 4 | 5 |
| Total energy use (10x) | 6 | 9 | 12 | 15 |
Fossil fuel use is a centerpiece of modern industrialization. The industrial revolution may not have occurred without coal. Coal has also fueled China’s mighty industrial revolution of the last few decades. World coal production, including production in China, seems to have peaked, however, in about 2013 and gas has eclipsed coal as the leading source of electricity in the U.S. Environmental concerns, especially climate change, have initiated the phasing out of coal.
Perhaps the best book ever written about energy is Daniel Yergin’s The Prize: The Epic Quest for Oil, Money and Power which won the Pulitzer Prize in 1992, and was revised and updated in 2011. A 900-page seminal work on world oil history, we will here recount only a few of its themes. Yergin introduces the concept of hydrocarbon man—comparable to earlier epochs of cave man, bronze age man, iron age man—and so forth, to describe the state of 20th century technological progress. You and I use hydrocarbon fuels every day of our lives, for transportation, electricity, and to heat our homes.
The modern transnational corporation was invented by John D. Rockefeller of Standard Oil, the monopolist forerunner of ExxonMobil, Chevron, and other corporate giants. In fact, the game of Monopoly is based partly on Rockefeller and Standard Oil where the game is won by driving all your opponents into bankruptcy.
Calouste Gulbenkian, a Turkish oil trader, opened the door to American and British involvement in Persian Gulf oil fields through his Iraq Petroleum Company, and in linking Middle East oil to Western industrial development, he became the richest man in the world in the 1930s and 1940s.
Oil is an essential tool of modern warfare, to power airplanes, ships, tanks, trucks, jeeps, even missiles. If Nazi Germany and Japan hadn’t run out of it, WWII may well have had a different outcome. The Persian Gulf War of 1991–1992 was fought to reverse Saddam Hussein’s annexation of Persian Gulf neighbor Kuwait and to prevent Iraq from also attacking Saudi Arabia and gaining control of half of the world’s oil reserves. Oil continues to be a major factor in 21st century global geopolitics.
The economic principles we studied in Part II of this text play an important part in the history of oil, and they will play no less a part in its future. It is a nonrenewable resource with a finite life span as we have seen. Inelastic supply and demand give it a volatile price. The real action, however, is a political power struggle over the economic benefits of oil. As oil consumers, you and I want to spend as little as possible for gasoline and other oil products to maximize our consumer surplus, and the governments of the U.S. and other oil importing nations want to minimize money sent abroad for imports.
The Organization of Petroleum Exporting Countries (OPEC) cartel sees things differently. By restricting the supply, they can force the price upward, expanding their export revenues. The economies of Iraq, Iran, Kuwait, Saudi Arabia, Venezuela, and even Russia are dependent on oil revenues and go up and down with the price of a barrel of crude. Americans’ ability to conserve oil is limited by the vehicles now on the road, which are replaced on average only every 13 years, and by the geographical patterns of our towns and cities, which are so often designed to facilitate automobile rather than foot or bicycle traffic and lack adequate public transit. We call it sprawl.
The present is even more a product of the past in the electricity industry because it is the most capital-intensive sector of the economy. Coal and, even more so, nuclear power plants cost billions of dollars to build and it takes decades of electricity sales to pay off the mortgage. They can’t be shut down economically until their useful life of 50 years or more is over. An older plant that is paid off, but still operates in good condition, is very profitable, like living in a house after the mortgage-burning party. Half of U.S. electricity comes from coal and nuclear power plants and hydroelectric dams that are more than 30 years old. The electricity supply for the rest of your life will come from the power plants that are newly built, under construction, and planned for construction in the near future. These, however, are no longer mostly coal, nuclear, and hydro; they are wind, gas, and solar. Decisions like these to construct expensive infrastructure have enormous long-term consequences, both positive and negative, for natural resource use and environmental outcomes.
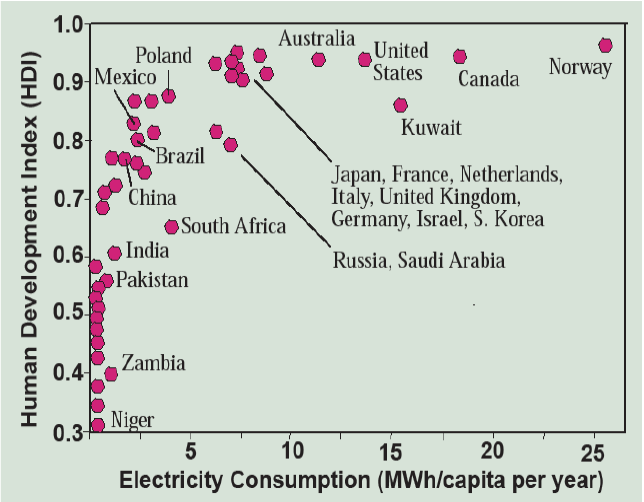
The historical and geographical process of building power plants and distributing electricity to the population, almost always starting with the urban and affluent and proceeding to the rural and poor, is a cornerstone of economic development. Figure 14.2 shows the relationship between the Human Development Index (similar to the Genuine Progress Indicator or Index of Sustainable Economic Welfare we examined in Chapter 7) and electricity consumption for 43 countries in 2003–2004. The majority of people in the poorest countries, an estimated 1.2 billion altogether, lack access to electricity. They have corresponding HDI scores of 0.7 or lower. At the other end of the spectrum, all countries with HDI of 0.9 or greater consume at least 5,000 kilowatt-hours per person per year. Among them there is also a huge range, however, from around 7,000 in affluent Western European and Northeast Asian countries, to twice that in the United States, even more in Canada, and 26,000 kilowatt-hours per person in hydropower-rich Norway. So while reliable access to electricity is a key component of a high-quality middle-class lifestyle, efficient and parsimonious use does not diminish quality of life and excessive use does not improve it.
It is remarkable how inefficient energy use can sometimes be—thereby showing us how much room there is for improvement. In your car, 88 percent of the energy in gasoline is consumed in the engine, driveline, accessories, and idling. Another 6 percent is lost to air and road friction, leaving six percent to move forward, but 5.7 percent moves the heavy car forward. Only 0.3 percent of the energy propels the driver.
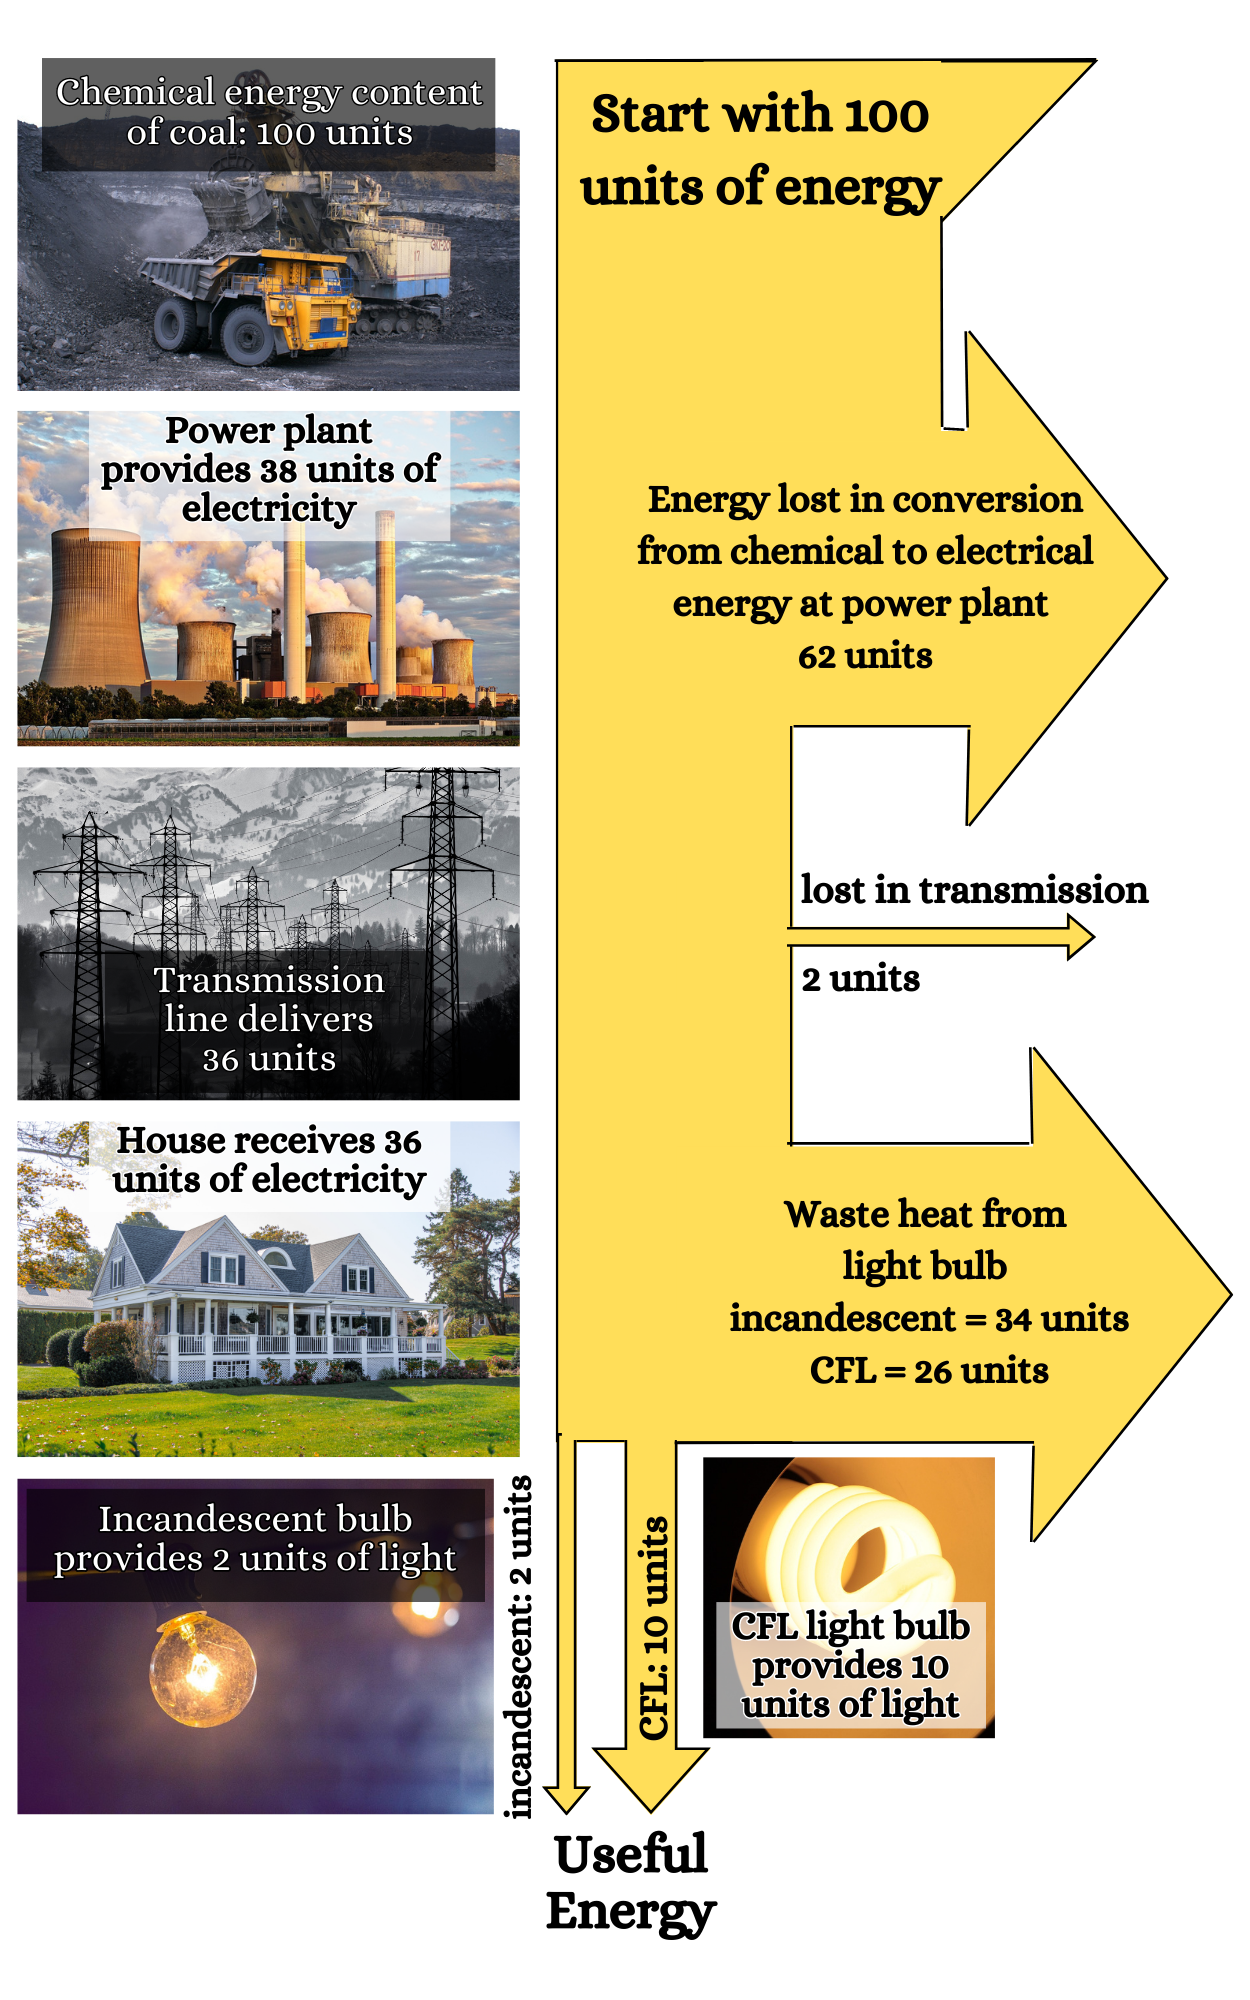
Take a typical, old-fashioned incandescent light bulb (Figure 14.3). The coal delivered to the power plant contains 100 units of chemical energy, but 62 of these are lost in converting it to heat and then to electricity. For this reason, it makes more sense to heat your home by burning a fossil fuel (usually gas) directly than to convert it to electrical resistance heating. Two more are lost along the transmission line, delivering 36 to the light bulb. But 34 of these are lost as heat rather than light, leaving only 2 of 100 units of energy to provide light, with 98 units as waste. Likely, only a small percent of that helps someone see better.
More efficient compact fluorescent lights (CFLs) greatly reduce the loss of electricity as heat. LEDs are even better. Even more energy could be saved with lights that come on only when someone enters a dark room. Nearly everywhere in our economy, we have older items of manufactured capital, from short-lived light bulbs to medium-lived vehicles to long-lived buildings and power plants that were built in an era of energy abundance and climatic bliss and use energy inefficiently. As we move to an era of energy efficiency, we must keep in mind that manufactured items that use energy are replaced one at a time in an ongoing economic process that takes decades. In fact, the average building in the U.S. lasts 70 years, about the same as the average person, so the country rebuilds itself, in terms of both manufactured and human capital, every seven decades or so. Energy efficiency is largely won through this process of replacing inefficient manufactured capital with more efficient technology. How much more energy efficient will the buildings now being designed and constructed be?
The Ghost of Energy Present
Where do Americans now get their energy and what do they use it for? Figure 14.4 gives an overview from the U.S. Energy Information Administration in quads—quadrillion btu. In 2018 our energy supply of 122 quads came from a variety of sources, but with fossil fuels (oil, gas and coal in that order) providing 79 percent of the total, including over 21 quads of imported oil, though there were also 14 quads of oil exports. Net imports were only 3 percent of overall energy supply, the lowest level in decades.
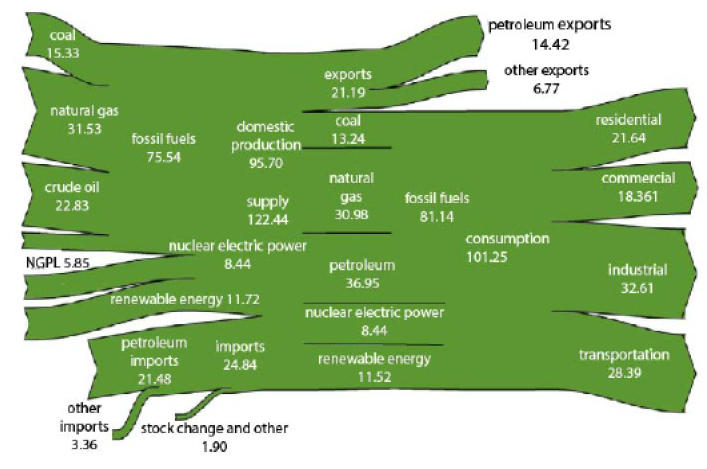
Americans consumed 101 quads, 81 from fossil fuels plus 8 as nuclear and 12 as renewable sources of electricity. This energy was distributed among the industrial (32.6 quads), transportation (28.4 quads), residential (21.6 quads), and commercial (18.6 quads) sectors. Transportation is very oil-dependent, but the other sectors largely depend upon natural gas and electricity—which itself comes from various sources that we will explore next.
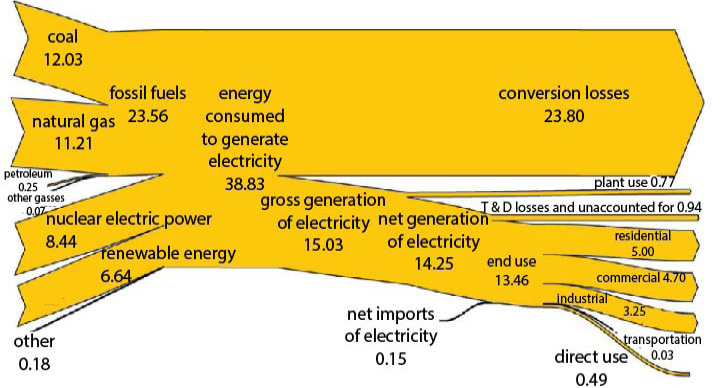
The flow of energy in 2018 through the U.S. electricity sector is shown in Figure 14.5. Natural gas at 11 quads (29 percent) of the total is neck-and-neck with coal at 12 quads (31 percent). About 100 nuclear power plants provided over 8 quads (22 percent), and renewables, lumped together for the moment, provided 7 quads (17 percent) of electrical energy. You’ll quickly notice that 61 percent of the energy consumed is lost in conversion from chemical energy (in hydrocarbon molecules) to heat to electricity, leaving 15 quads of electricity actually produced. Another 9 percent of this is lost in running the plants and distributing electricty through transmission lines, leaving 13.46 Quads of electricity actually consumed. This electricity is divided up into the residential (37 percent), commercial (35 percent), industrial (24 percent), and other sectors.
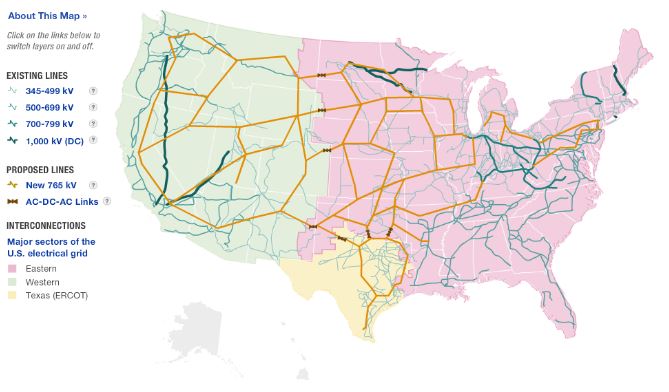
So there’s our snapshot of where we get our power, but as Gretchen Bakke in her 2016 book The Grid: The Fraying Wires Between Americans and Our Energy Future tells, electricity is a lot more interesting than these percentages. The Eastern Interconnection of the U.S. grid (Figure 14.6) is the biggest machine in the history of the world. Electricity is a generic product—there is no difference between power coming from a coal, nuclear, gas, hydro, wind, or solar power plant. They are all just electrons racing their way back to the nucleus to balance the electrical charge of atoms. They all feed into the grid, which delivers electricity to each of its tens of millions of customers throughout the Eastern, Western, and Texas Interconnections.
Unlike any other product, electricity demand is like a crying baby—its needs must be met immediately, on a second-by-second basis, from plants connected to the grid. Expensive to build, but very cheap to fuel and run, nuclear power plants provide base load all of the time, along with less expensive to build and relatively cheap to fuel coal plants (Figure 14.7). On a hot summer afternoon, however, when all of the air conditioners come on, there is a need for peaking power. That’s when the smaller, more flexible, and less expensive to build, but more expensive to fuel, natural gas plants get turned on one at a time to continuously balance electricity supply and demand on the grid. Hydroelectricity can also be managed to supply peak load if there is sufficient water in the reservoir. It is important to note that investments in power plants and transmission lines must be sufficient to meet peak, not average, demand, just as roads and bridges are built to accommodate rush hour and parking lots to suffice during the biggest event. That makes the distribution of demand over time an important issue in natural resources sustainability, especially for electricity.
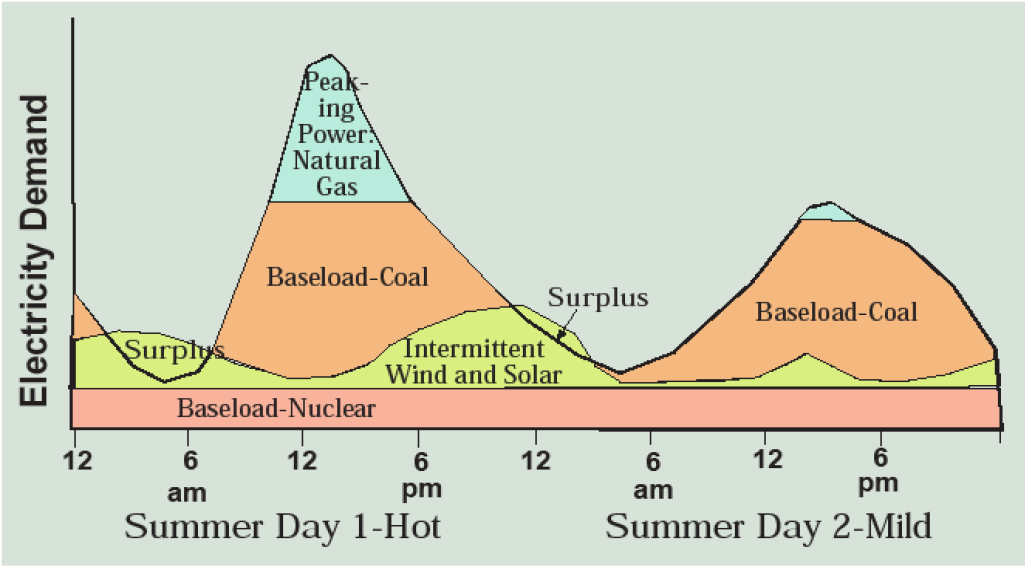
Wind and solar power are harder to control since the energy comes from the natural transfer of energy in moving air and sunlight. They are intermittent or variable sources and therefore present problems in managing the grid to meet instantaneous demand.
For water, we solve this problem of supply and demand not matching over time with storage by building dams that form reservoirs. We also store large quantities of oil, in vehicle’s gas tanks, oil depots, even the Strategic Petroleum Reserve underground in Louisiana. But for electricity, storage is a major dilemma, one upon which the future of wind and solar energy hinge. How can surplus wind and solar power be stored up to meet peak demands that occur hours or days later (Figure 14.7)?
Let’s now proceed to examine options for our energy future on source-by-source basis, with the first source being energy efficiency.
Ghosts of Energy Future: The Sustainable Energy Revolution
An overdue sustainable energy revolution has begun. Even as electric cars start rolling out, the transformation in how that electricity is produced and managed is even more profound. Just look at the difference between where our electricity came from in 2018 (Figure 14.5; coal, gas, nuclear, and renewables, led by hydro) and what was planned for construction in 2019 (Figure 14.8; 46 percent wind, 34 percent gas, and 18 percent solar). The future will be substantially different from the past but there will also be continuity; the present is the beginning of the journey to the future, especially where there’s over a trillion dollars worth of infrastructure already in place. With this in mind, let’s begin by looking at energy efficiency and only then proceed to energy sources.

Efficiency, Efficiency, Efficiency
Both the U.S. and the world have become more energy efficient in the sense that the amount of energy used per dollar of national income produced has been steadily falling. As population and the economy grow, however, total energy use worldwide continues to grow, but it has plateaued in the U.S. since about 2000 at around 100 quads. It’s a considerable accomplishment to expand the economy by more than 40 percent without substantially increasing energy consumption; this is a victory for efficiency. In previous chapters, we have discussed how world population can be stabilized and how growth can be uneconomic. Here we will examine ways in which energy use can be reduced without sacrificing basic energy services of mobility, access to electrical technologies, and comfortable indoor temperatures. For this reason, we will use the term efficiency—which implies technological progress or behavioral change to deliver more energy services with less energy generation—rather than conservation, which implies foregoing desired energy services. In fact, in developing countries, delivering more energy services is critical to improving human welfare.
We also have to make a distinction between theoretical or best-case energy efficiencies and real-world applications. Demonstration buildings have achieved over 90 percent reductions in energy use, or even become net energy producers, but the entire fleet of buildings in use is becoming more efficient at less than one percent per year. Gasoline-powered cars have been designed to exceed 100 miles per gallon, but only slow progress has been made in the U.S in improving the fuel efficiency of the average vehicle on the road. Customers often prefer, or are convinced they prefer through advertising, other attributes such as size, styling, and performance, and financially stressed auto-makers often advertise SUVs, minivans, and trucks because of their higher profit margins.
The difference between possible and real-world energy efficiency lies in economic incentives, dissemination of new technology, and overcoming on-the-ground problems of implementing change, including customer habits and preferences. For example, despite the marketing power of Toyota, Honda, and Ford, only 2.8 percent of new automobile sales in the U.S. in 2016 were hybrids (2 percent), plug-in hybrids (0.4 percent), or electric vehicles (0.4 percent). The 97 percent of new automobiles that are not hybrids will be using, on average, a gallon of gasoline for every 25 miles through about 2030.
CFL light bulbs save at least 75 percent of the energy used by incandescent light bulbs, last perhaps ten times as long, and are available at reasonable prices in nearly every store, yet their adoption by customers lagged until regulations began phasing out incandescent light bulbs. Rail-based public transit uses less than one-tenth as much energy per passenger mile than the average for automobiles. Yet in 1970, U.S. passenger cars and small trucks provided 2,516 times as many passenger miles and in 2006 this had increased to 4,152 times as many. The energy Titanic turns agonizingly slowly even while the icebergs approach.
There is also a problem of customers misperceiving the economics of energy efficiency investments. For example, an energy efficient refrigerator with the freezer on the bottom may cost $1,500 and consume $50 worth of electricity per year while an inefficient one will cost $1,200 and consume $150 in electricity costs per year. Over ten years, the efficient model costs a total of $2,000 (1,500 + 10×50) while the inefficient model costs $2,700 (1,200 + 10×150). But customers don’t make this calculation; they simply buy the refrigerator based on the price tag and how much they like it—and they are used to having the freezer on the side or the top.
In other circumstances, there are split incentives. Landlords don’t invest in insulation because renters pay the heating bill, but renters don’t invest because they won’t stay long enough to reap the efficiency rewards. Or homeowners don’t invest in solar panels, ceiling fans, or efficient natural gas furnaces because they don’t carry forward into the sales price of the house, which makes banks reluctant to offer home improvement loans for them. A majority of Americans carry consumer debt, such as credit card balances, and have difficulty mustering a capital investment of a few thousand dollars even if it would pay for itself in a few years of reduced energy bills. There’s also a lack of informational feedback. When you buy an article of clothing, you take money from your wallet and hand it to the clerk, but when you turn on the air conditioner, the expense disappears into a complicated monthly utility bill you may not even bother to look over. A real-time meter that graphs electricity charges placed next to the thermostat might provide the feedback you need to make solid economic decisions about energy use.
Habits play a role as well. How about turning off unneeded lights or the air conditioner when the heat wave abates? In warm summer weather, you can close windows and curtains in late morning to keep out the hot sunlight and open them in the evening to let in the rapidly cooling air. Unplugging the computer and TV set when leaving town, or the coffee maker when it’s done brewing, eliminates electricity waste in stand by mode; this is sometimes called vampire load. Cold water washes most clothes as well as hot. When you need an item at the grocery store, do you check the kitchen for other items that are also needed to save the next trip, or think of another errand that can be accomplished on the way? Differences in driving habits can amount to as much as a 25 percent difference in gasoline mileage in the same vehicle. For example, try keeping plenty of distance between you and the car in front of you so you can limit braking and acceleration. Slow down way back from a red light so it turns green by the time you get there. Of course, maybe you can leave the car in the garage, driveway, or parking lot sometimes. Developing a good habit is an investment, because once it becomes routine, its automatic.
With this introduction, let’s explore some of the most important opportunities to improve energy efficiency in major sectors: buildings, industry, and transportation.
Buildings use 39 percent of all energy, mainly for heating, cooling, and electrical devices. A combination of insulation and reducing air infiltration, passive solar design, modern window designs that maximize daylighting, efficient heating and cooling systems, and setting temperatures around 65 in winter and 75 in summer has been shown to reduce energy consumption by up to 90 percent. It is far more difficult, however, to retrofit older buildings than design new ones for energy efficiency. This places the focus on building codes so that as the building stock turns over, it becomes more efficient over a period of decades. In the meantime, periodic energy audits that identify and rectify sources of waste have been demonstrated to reduce energy use by 10–30 percent or more.
Refrigerators are an energy efficiency success story in the U.S. In 1977 they consumed an average of 1,800 kilowatt-hours per year, but by 2002 this fell to only 450 kilowatt-hours. This success was driven by appliance standards first in California and then nationally. TVs and computers could follow suit by minimizing energy use while in standby mode. Appliance standards and building codes are a key tool in achieving electricity efficiency in buildings.
Industry uses 32 percent of all U.S. energy with more than half of this in the energy-intensive industries of iron and steel, aluminum, chemicals, petroleum refining, cement, and pulp and paper. Fortunately, economic incentives to reduce energy use are strong in this sector because it is an expensive factor of production, increasing the likelihood that cost-effective investments will be made. Recycling is the best way to reduce energy use in the metals industry, saving 78 percent of energy use in steel making and more in aluminum.
Transportation uses 28 percent of energy, two-thirds of this for passengers and one-third for freight. Energy use in vehicles can be made more efficient by reducing weight, aerodynamic drag, and tire-rolling resistance. Between 1990 and 2007, average miles-per-gallon in U.S. vehicles actually declined from about 25 mpg to 22 mpg, largely due to the popularity of truck-frame vehicles (SUVs, minivan and pickups) for routine personal transportation that circumvents Corporate Average Fuel Economy (CAFE) standards. In 2012 the Obama Administration issued ambitious fuel-efficiency standards to improve fleet-average levels to 36.6 mpg in 2017 and 54.5 mpg in 2026. Watch to see how this important experiment in improving natural resources sustainability plays out in the policy arena, in the engineering divisions of auto corporations, and on the road.
Much more substantial energy savings, 90 percent of more, can be made by transferring passenger miles from air and automobile to rail. Let’s face it, the U.S. has the worst passenger rail system of any industrial country, lagging behind even China and India. It has been well documented that oil and automobile interests actively removed urban public transit systems in the mid-20th century to make Americans more dependent on their products. Simultaneously, this limited access to affordable transportation for the poor, young and elderly, and visually impaired and has greatly encouraged suburban sprawl.
This situation, which forces the average American to drive over 13,000 miles per year, must simply be reversed, but how to do it? Great cities have great subways, like the New York subway, the Washington, DC metro, and the Chicago L trains, and the stations become commercial hubs. Yet, given the mediocrity of urban public transit elsewhere and the nearly complete failure of intercity rail transit in the U.S., maybe technology can provide another model. The seeds of such a system may lie, within the city or town, in small, one-seater autonomous electric vehicles (a.k.a. robot cars) that can be hailed on cell phones on the Uber/Lyft business model. Very fuel-efficient, they would only need to park when recharging, with their batteries providing electricity storage to meet peaking power needs. Expect a development similar to this to become available in larger U.S. cities in the 2020s.
Between cities and for moving freight, the hyperloop shows such great promise that Germany plans on using it to transport freight in and out of the large port at Hamburg, India is planning a passenger route out of Mumbai, and construction has begun in Abu Dhabi. The idea, illustrated in a 2013 white paper authored by Elon Musk, is based on the proven technology of magnetic levitation now used in some high-speed rail. The twist is to overcome the high wind resistance that occurs at high speeds by running the trains in a vacuum tube like the one you may have used at the bank drive-up teller. This technology promises speeds in the range currently achieved by jet airplanes at less than 20 percent of the energy consumption because the trains run in a friction-free environment. Keep your eyes on this exciting development in transportation technology; I’m betting most of those reading this will one day take a hyperloop ride at over 300mph, maybe way over.
Evaluating Energy Sources
What would be the perfect energy source? The economist wants it to be cheap. The environmentalist wants it to be clean and safe. The politician and the patriot want it to be domestic. The resource expert wants a large, long-term supply. The engineer wants it to be technologically well understood and serve well in two specific energy use contexts—electricity and fuel for vehicles. Will all the cheap, clean, safe, domestic, well-understood energy sources with a large, long-term supply applicable for electricity and vehicle fuel please stand up! Why is no one standing? Perhaps because we have no perfect energy sources. Instead we have to make choices about which of these ideal characteristics we’re willing to trade to get some of the others.
With this in mind, let’s evaluate our energy sources like an instructor assigns grades in a course (which almost always involves some degree of subjectivity). Table 14.2 gives my grades on each of these criteria for our major energy sources (coal, hydroelectricity, natural gas, oil, wind, solar, nuclear, biofuels). Note that I’ve listed them according to the economists’ criterion because price is the first test of an energy source in our economic system where the criteria of clean and safe are only partially internalized into the price. If they were fully internalized, we’d have an ecological-economic criterion that serves as a better yardstick in evaluating these energy sources for sustainability. Let’s proceed with how I came up with these grades, but you’ll have to assign each source a final grade based on how important you think each of the criteria are.
Table 14.2. A grade sheet, based on the author’s subjective judgment, for energy sources using eight criteria.
|
Source |
Cheap |
Clean |
Safe |
Domestic |
Large, long- term supply |
Well under stood |
Useful for electricity |
Useful as vehicle fuel |
Overall Grade |
|
Coal |
A |
F |
B |
A |
A |
A |
B |
C |
? |
|
Hydroelectricity |
A |
C |
B |
A |
C |
A |
A |
C |
? |
|
Natural Gas |
B |
B |
B |
A |
B |
A |
A |
C |
? |
|
Oil |
B |
C |
B |
C |
C |
A |
B |
A |
? |
|
Wind |
B |
A |
A |
A |
A |
A |
C |
C |
? |
|
Solar |
B |
A |
A |
A |
A |
A |
C |
C |
? |
|
Nuclear |
C |
A |
C |
A |
A |
B |
B |
C |
? |
|
Biofuels |
C |
F |
A |
A |
F |
B |
C |
A |
? |
Coal and “Clean” Coal
Coal is by far the most abundant and least expensive fossil fuel with a resource base sufficient to supply current rates of extraction for centuries. Moreover, the United States has about one-fourth of world reserves, 251 billion tons with over half of this in eastern Montana, Wyoming, and southern Illinois, and production each year of about one billion tons. This supplies about one-third of U.S. electricity. These factors account for its As.
Coal gets a B on safety because coal mining remains a dangerous occupation and a C on usefulness in a vehicle because coal can only be used if converted to oil using the Fischer-Tropsch process, which is expensive and results in large greenhouse gas emissions. The problem is that coal gets an F on clean due to (1) atmospheric emissions of carbon dioxide, sulfur oxide, nitrous oxide, mercury, and more radioactivity than most people realize from the smokestack, and (2) scars and acid mine drainage from mining.
Recently, the coal industry has invented the phrase clean coal. Is it another oxymoron? It is possible to gasify coal into methane, which when burned produces only water and carbon dioxide. Another approach is to capture the carbon dioxide in power plant smokestacks and put it back into the Earth in a process known as carbon capture and sequestration. Most people, including myself, are skeptical when they first hear this idea of geological sequestration. I’ve become more optimistic, however, because carbon dioxide is harmless in the Earth where it can’t absorb long-wave radiation and, likely, we can trap it where it will stay put for many thousands of years.
The world emits about 12 billion metric tonnes of carbon dioxide per year from coal combustion with over one billion tonnes coming from the U.S. The InterAcademy Council, in an excellent 2007 publication called Lighting the Way: Toward a Sustainable Energy Future, estimates that oil and gas fields can sequester 675–900 billion tonnes globally, enough for several decades. The carbon dioxide increases reservoir pressure, allowing a higher proportion of the oil or gas to be produced. This element makes it more economical to pipeline carbon dioxide from coal-fired power plants to oil and gas fields, but it also results in carbon dioxide emissions from the extra oil and gas produced. Moreover, oil and gas fields are not as easy to secure from carbon dioxide leaks as are other geologic environments because of the production wells that have been drilled through the overlying geologic trap.
The second option is to sequester carbon dioxide in unmineable coal seams to enhance methane production. The third option is to store carbon dioxide in deep saline groundwater, making salty club soda (this is the meaning of a carbonated beverage). The capacity is enormous: 1,000–10,000 billion tonnes. The lower estimate would serve for the remainder of the century and the higher estimate could likely store carbon dioxide from all remaining fossil fuels on Earth. Moreover, these formations are very good traps, making the likelihood of leaks very low. And even if slow leaks were to occur far in the future, the oceans could absorb carbon dioxide emitted at slower rates than are now occurring.
So I’m cautiously optimistic about the sustain-ability of storing huge amounts of carbon dioxide in the Earth. In fact, sequestration is necessary if most of the Earth’s remaining coal, and perhaps natural gas, resources are to be used as an energy source without causing unacceptable climatic disruption. Without sequestration, most remaining fossil fuels are standed assets. This addresses the dilemma presented at the end of Chapter 13 where climate change, rather than the resource base size, is the limiting factor in fossil fuel use.
Putting these factors together, I conclude that coal’s future will look completely different from its past and declining present. The future could be based on coal gasification with carbon capture and sequestration in a policy environment where carbon emissions are levied a charge or regulated. It will no longer be cheap. It’ll take time for the technologies to be perfected and plants to be designed, authorized, and constructed. Don’t expect the first truly clean coal power plant to come on line before 2030, if ever, but if successful, it could eventually replace all of the coal-fired electricity generation in the U.S. and provide a more sustainable approach to coal-based electricity for the world, especially China, which is pushing ahead of the U.S. in clean coal technology.
Hydropower
Water falling downhill by the force of gravity can spin a turbine to directly generate electricity. The amount of water and the distance it falls determine how much. In most hydropower projects, a dam is constructed on a large river to store water, thus allowing the amount of water flowing through the turbines to be controlled, and to increase the distance it falls, thus increasing power produced (An interesting exception is Niagara Falls where at night the water is directed through holes drilled in the rock behind the falls).
Nature provides only a relatively small number of locations where large amounts of water fall considerable distances. For example, North America’s largest river, the Mississippi, has a low gradient; it falls less than 1,000 feet from its source in Minnesota to the Gulf of Mexico. The Columbia River of the Pacific Northwest has both large water flows and a steep gradient, so it is the leading hydropower producing river in the U.S. This makes electricity rates in Oregon and Washington the cheapest in the U.S. Canada is hydropower-rich, especially in British Columbia in the mountainous west and Quebec and Labrador in the wet and rocky east.
Give hydropower an A for being cheap, domestic, well-understood, and useful for electricity, including as peaking power, and a B for safety because we have yet to see a catastrophic dam break at a hydropower facility.
U.S. hydroelectric development began in earnest in the 1930s with the construction of Hoover Dam on the Colorado River. Development accelerated in the 1960s and 1970s as the Bureau of Reclamation and the Army Corps of Engineers raced to develop the best dam sites. Little development has occurred since 1980, however, for a variety of reasons. First and foremost, the choicest sites accounting for 76 percent of technical capacity were developed first, leaving only inferior leftover sites for further development. Second, federal funding for water resources projects was reduced in the 1980s in favor of local cost sharing. Suddenly, local support of new projects evaporated when they had to pay for them. Third, environmental opposition to dams accelerated as we discussed in Chapter 6. Regret over the drowning of the Hetch Hetchy Valley, a twin of Yosemite Valley in the Sierra Nevada of California, shot dead proposals to place hydroelectric dams in, for example, the Grand Canyon.
The most salient environmental issue in hydropower development involves migratory and anadromous fish such as salmon. Salmon migrations plummeted in the Columbia River basin following hydropower development and have not recovered. Once prodigious salmon species are now on the endangered species list. Fish ladders have proved to be fairly effective in getting adult spawning salmon upstream past the dams, but juvenile salmon struggle to make the downstream journey to the sea, getting lost in large reservoirs, tumbling through turbines, and becoming easy prey. Many millions of dollars have been spent in efforts to reconstruct salmon migration pathways throughout the northwest, with little progress to show for it. Anadromous fish migrations have also been impacted on the Atlantic Coast.
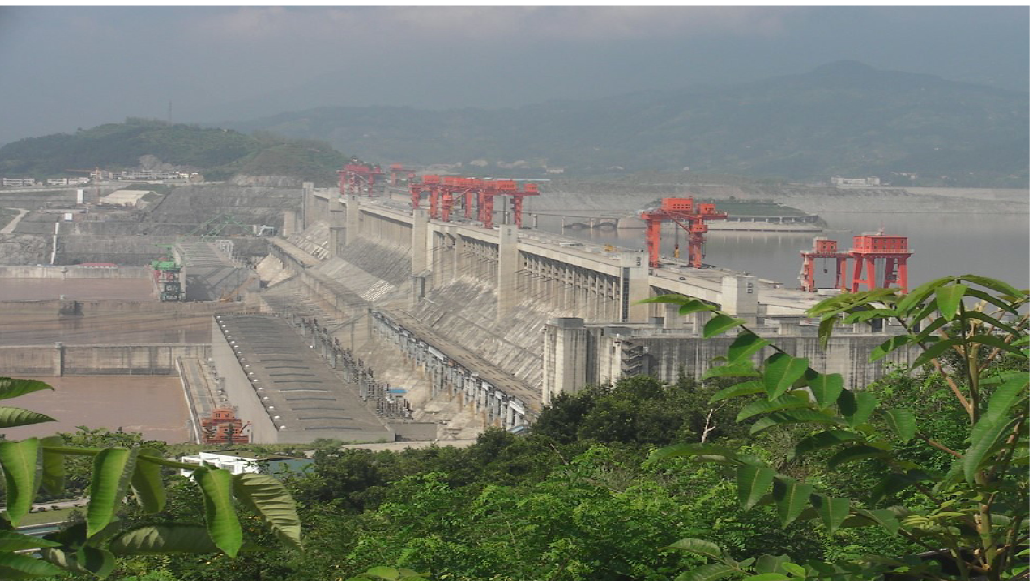
It is now nearly impossible to get a license to build a new hydropower project in the U.S. In fact, removal of economically unimportant hydropower dams is now occurring, such as two on the Elwha River in the Olympic Peninsula of Washington and two on the Penobscot River in Maine, successfully restoring salmon spawning to the upper reaches of those watersheds. Other regions of the world are rapidly developing a majority of their hydroelectric potential as the U.S. and Europe already have. The gigantic Three Gorges project on the Yangtze River of China (Figure 14.9) epitomizes both the advantages and disadvantages of hydropower. It provides inexpensive, renewable, pollution-free electricity while also storing a water supply for other purposes and providing flood control. It does so by reengineering an entire river system, however, turning rivers into lakes, blocking fish migrations and the flow of silt to the ocean, and inundating populous, agriculturally productive, or scenic valleys. Completed in 2008, the Three Gorges project triggered landslides and forced the migration of over a million people.
Hydropower raises quite different issues from other forms of energy generation and so my grading sheet is more subjective. I’ll have to fudge a C for being clean because it is pollution-free but has severe ecological and physical impacts on rivers. It has a long-term, in fact, perpetual supply, but of limited magnitude—another C. And you can’t use it to run your car unless it’s a plug-in hybrid or an EV—a C.
Wind
Nearly everyone likes wind power, and why shouldn’t they? On my grade sheet (Table 14.2) it gets As for being a well-understood, clean, safe, domestic source of energy and Bs for being affordable (if not quite cheap), for having a large perpetual supply, and for being a source of electricity, though an intermittent one. Too bad you can’t run your car on it—until you get an electric car.
Starting in the 1980s in California, wind power currently supplies over six percent of U.S. electricity and is expanding rapidly. In 2019 wind will be the leading source of new electrical power capacity constructed. Wind resources are excellent throughout the Great Plains as well as on the east shores (due to prevailing westerly winds) of the Great Lakes, the broad continental shelf of the Mid-Atlantic, and the narrow one along the Pacific Northwest coast (Figure 14.10).
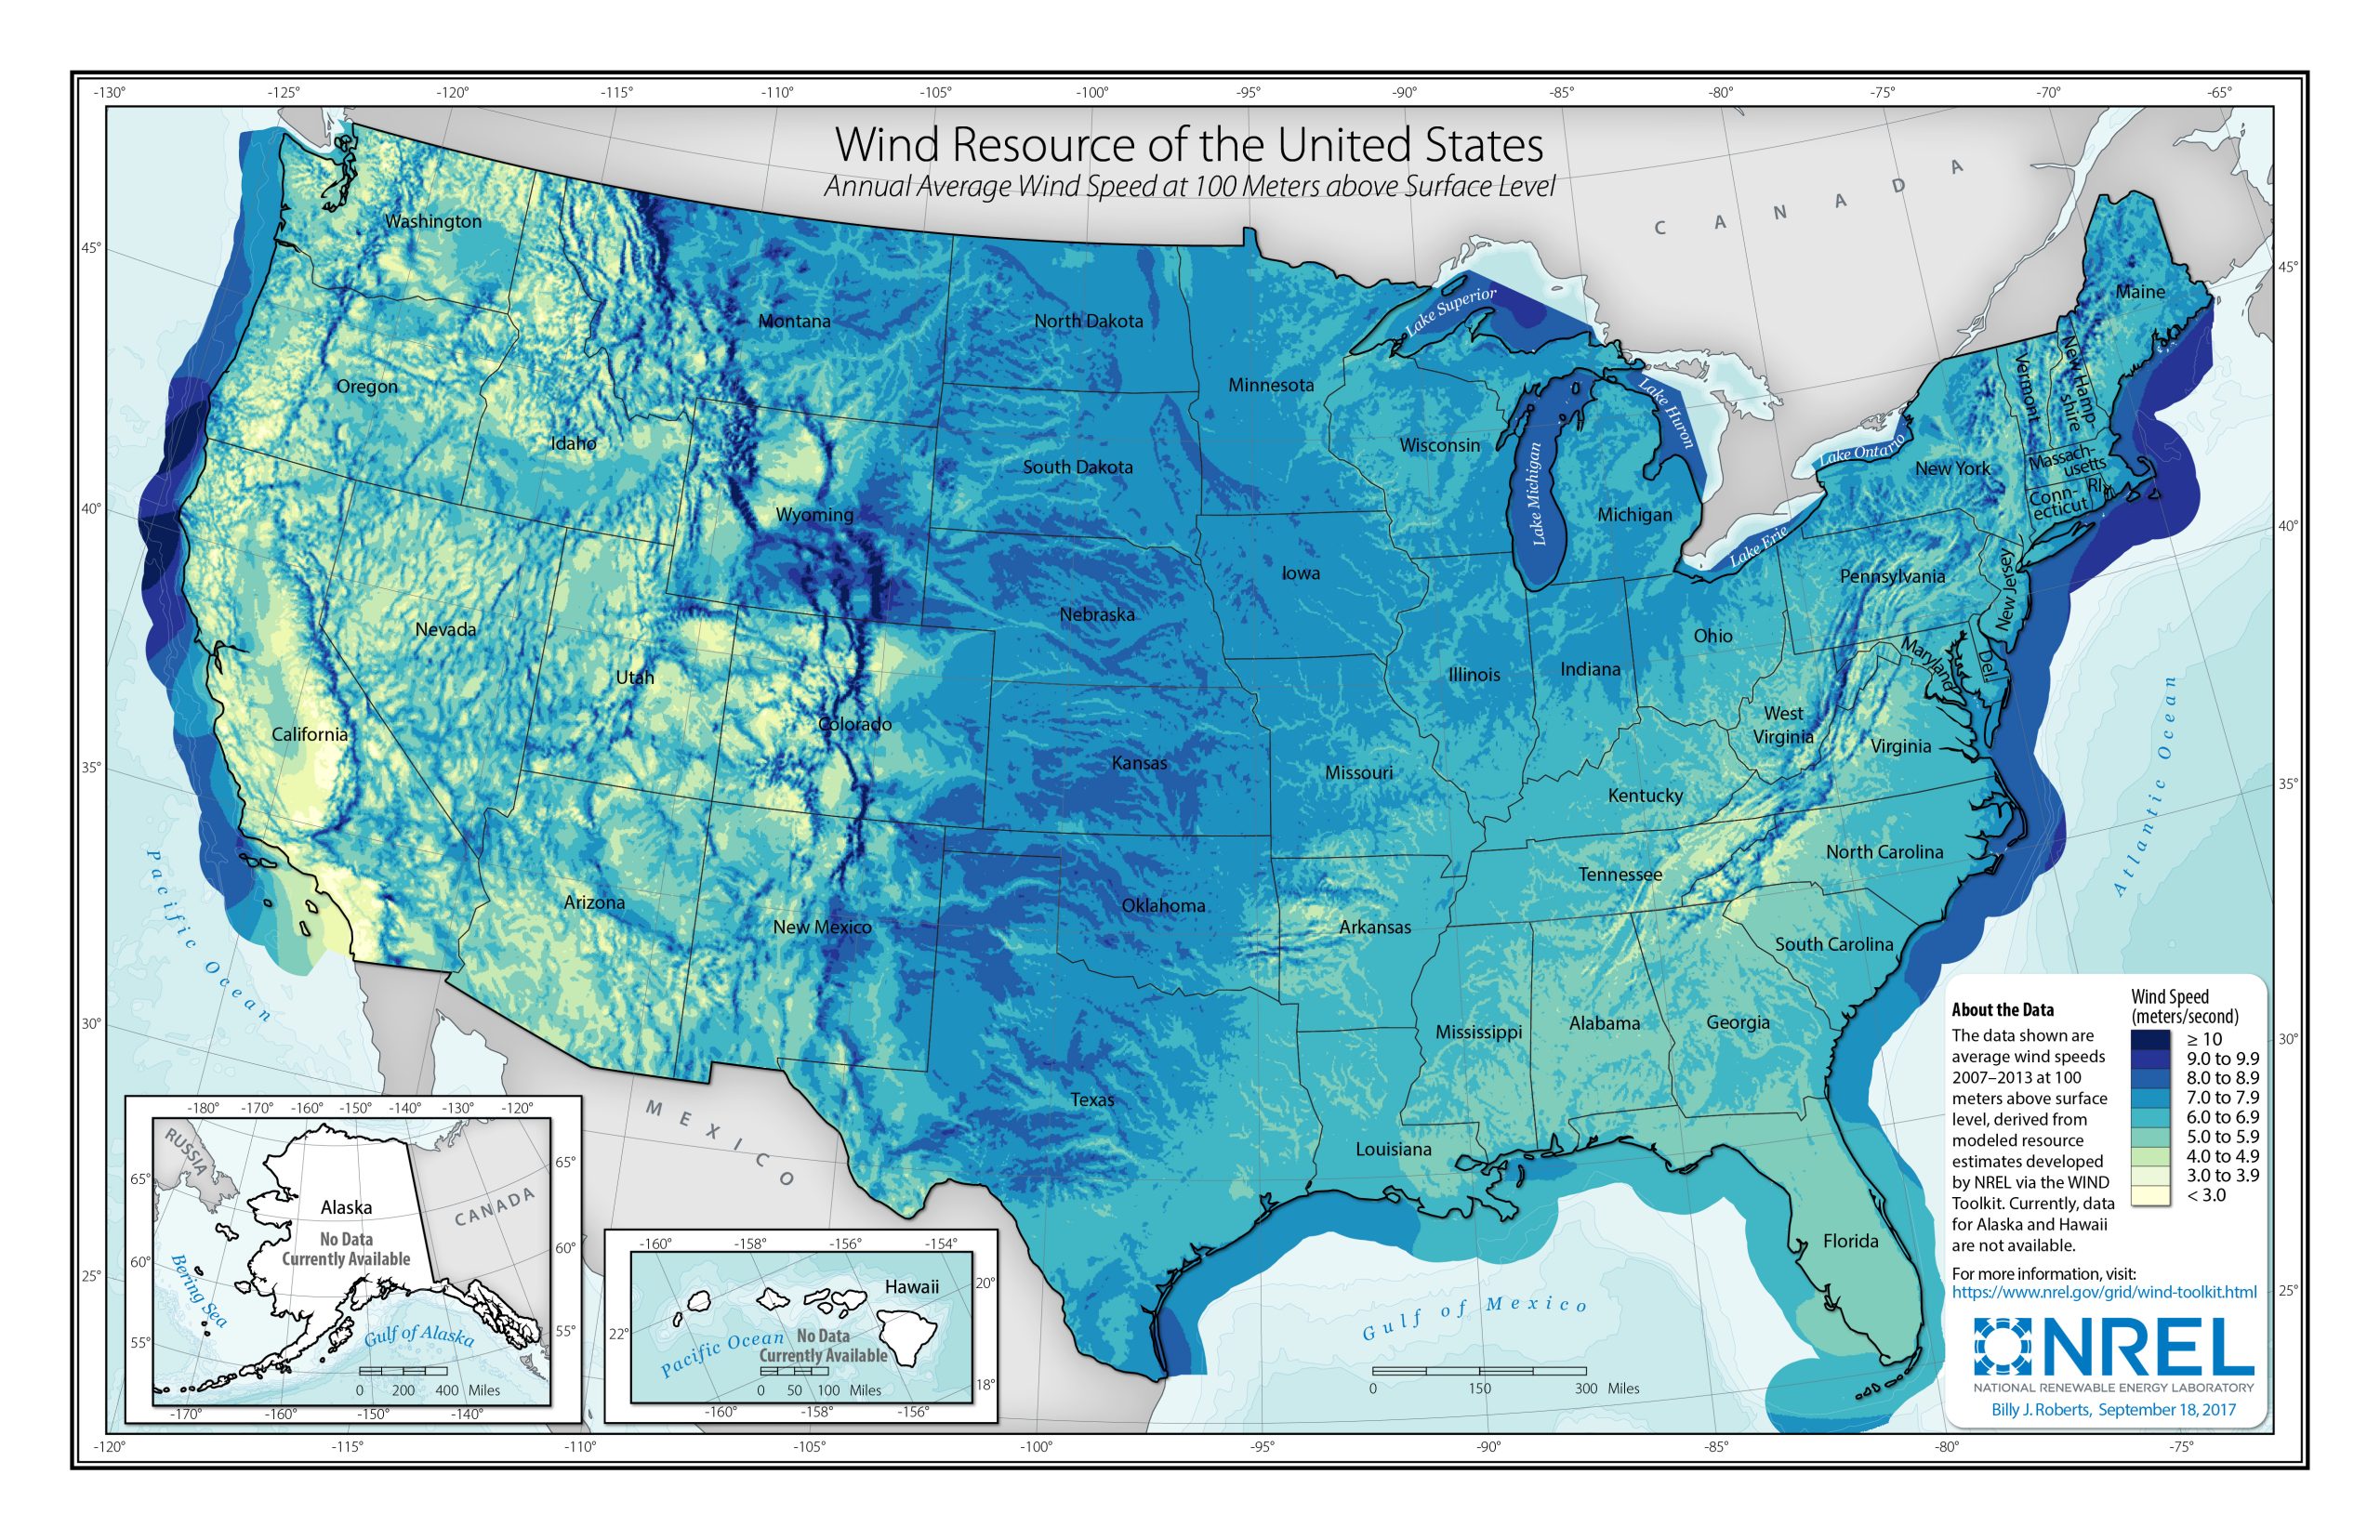
Of course, wind power has to be transported by transmission lines to the customer. Existing and planned wind farms are found in locations with better-than-average wind power potential, close to existing transmission lines and railroads or interstate highways and close, but not too close, to population centers. North Texas and the Iowa-Minnesota border have joined the North Sea shores of Europe and northwestern China as the world’s wind power capitals. All but a few of the calm southeastern states have some commercial-scale wind power installations. Texas is especially bullish on wind and their state laws for siting wind farms provide no opportunity for local opposition that has at times plagued wind power development in New England and elsewhere in the eastern U.S.
Wind has ushered in a new geography of energy. Figure 14.12 shows all the major electricity power plants in the U.S. categorized by color (green for wind) for the various sources and with the size of the circles proportionate to power output. There are many geographical patterns for all sources of electrical power that can be observed from this excellent use of cartography. How many can you discern?
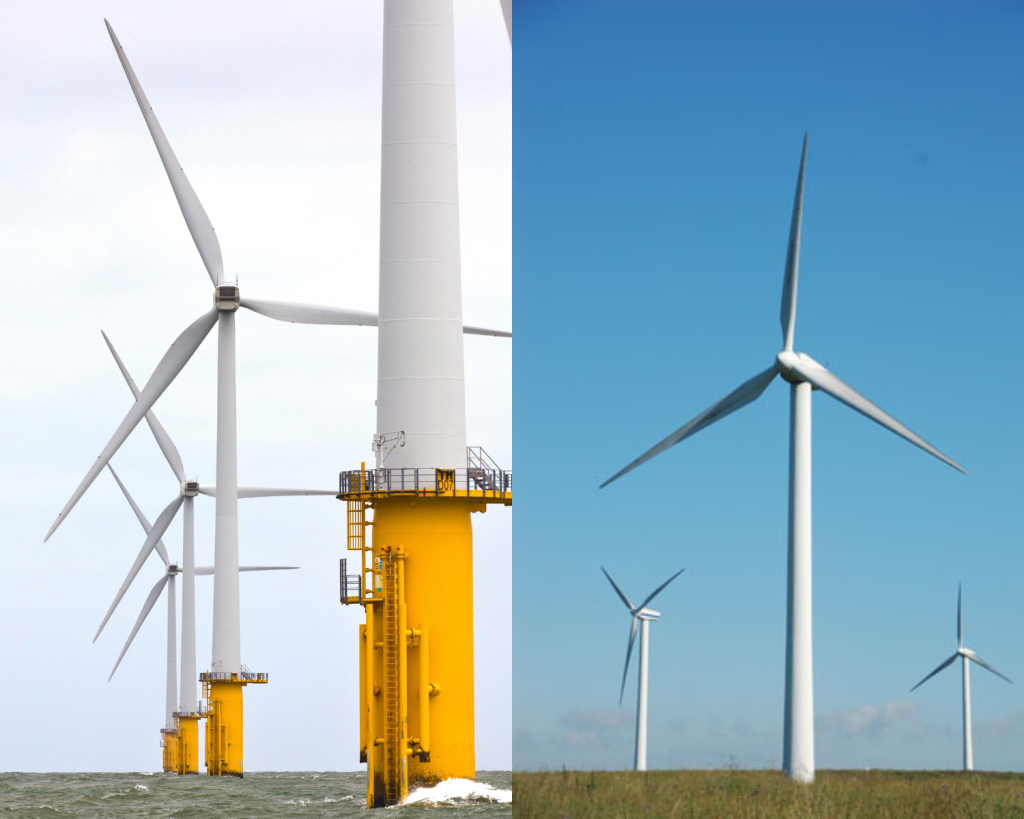
Wind is clean because it has no emissions to either air or water. While the turbines occupy a great deal of land, farmers can plant crops or graze livestock right under them, so they consume only enough land for the base and a one-lane gravel road to it—about an acre. The primary impact is visual with fields of turbines as tall as 500 feet ( Figure 14.11), though this can be either positive or negative depending on the context and the beholder. For example, four wind projects in New England and one in California have been blocked or long delayed, primarily on aesthetic grounds, but hundreds of projects elsewhere, especially in the agricultural plains of the central U.S., have gone forward with minimal opposition and often solid local support. It is also quite possible to build wind farms in shallow water where use of riprap or other materials for the base can improve fish habitat. Offshore wind power is just getting started in the U.S., but the potential is enormous, partly because the windiest areas are close to major population centers, especially along the northern Atlantic Coast. It is also possible to build even larger wind turbines in the ocean using ships.

Research and development efforts over the last few decades have produced a design for very large 5-megawatt turbine designs that are cost-effective and far less hazardous to birds and bats than earlier, smaller, faster-spinning designs. Wind power is currently only a bit pricier than coal and has intermittently enjoyed a subsidy called a Production Tax Credit, which greatly encourages investors.
Up to this point, it sounds like wind may in fact be the perfect energy source, but there are four issues under debate that we should explore.
First, the wind blows intermittently and with no regard for electricity demand (review Figure 14.7). The greater the proportion of wind (or, to a lesser extent, solar) power, the more difficult it becomes to keep the grid in balance. This requires either storing large amounts of electricity or balancing the grid with a lot of peaking power, likely from natural gas. Currently, the best technology for storing electricity is pumped storage—using surplus power to pump water to an upper reservoir, then regaining the hydroelectricity when needed by flowing it back down through turbines. The need to find other means to store electricity is so keen that underground caves are used to compress air when power is in surplus so that it can be released through turbines to meet peak power demand. Electricity storage is the limiting factor in expanding wind (and solar) power and the new technological holy grail in the electricity field.
The second issue is that the location of the windiest on-land sites is far from electricity customers and existing transmission lines feeding the grid. This means that the cost of wind power must include expensive investments in high-voltage transmission lines (see orange lines in Figure 14.6) connecting concentrations of new wind farms, say in the Dakotas, with concentrations of customers several hundred miles away, say in Kansas City, Minneapolis, Milwaukee, and Chicago.
The third issue is how large a proportion of electricity it could ultimately supply. The data I find most convincing show that it could supply all U.S. electrical needs, but this would require enormous areas of the Great Plains and shallow oceans to have dense swarms of wind turbines, zoning out only areas around towns, bird migration routes, and shipping lanes. It would also require surplus power to be stored, perhaps as hydrogen from splitting water molecules, to balance the grid. You decide whether this is a route you’d like the U.S. to take over the coming decades. Even if using wind for a majority of electricity is problematic, building up to the 20 percent level that the grid can handle in the next decade or two seems to be an essential step in energy sustainability.
A fourth issue is local public acceptability. Some argue that opposing wind farms is a case of NIMBY (Not In My Back Yard) in a selfish form. Others argue that wind turbines destroy the aesthetics of some types of landscapes and that the local community therefore has the right to say no. Others argue that the local community should be in on the income stream from the power sales to offset property taxes or build new schools. Whatever the answer to these questions, if a large wind farm was proposed near my home, I would want a vote, and I would vote yes, especially if it provided economic advantages to the local public sector, but no if it destroyed the aesthetics of the mountain ridge I and others frequently admire.
Natural Gas
When people think of fossil fuels, they think first of oil, then coal, and maybe then they remember natural gas. That’s a mistake. Over the next decade or two, natural gas will likely become the most important fossil fuel that pulls us through from our current overreliance on oil and coal to a more distant future reliance on . . . something else.
As we have seen, natural gas is the cleanest fossil fuel (I give it a B) with negligible air pollution emissions other than carbon dioxide and less of that (53 million tonnes per quad) per unit of energy produced than coal (95 million tonnes per quad) or oil (79 million tonnes per quad). As we saw in Chapter 15, its global supply is finite, but resource estimates have been rising with the shale gas boom discussed in Chapter 13 and below (I give it a B). We can anticipate increasing world gas production through at least 2030, while keeping in mind that, while it is not the long-term energy solution, it is a key 21st century transition fuel.
Natural gas gets an A for being well-understood, and an A(+) for its usefulness for electricity because of its flexibility as a source of peaking power. It gets a B for being domestic because North America has substantial reserves, especially as shale gas proves to be abundant. It’s safe, but you don’t want to go hunting for a gas leak in your basement with a candle or a cigarette lighter.
In 2013, 112,000 automobiles in the U.S. and 14.8 million worldwide ran on natural gas, and there have been no safety problems with storing the gas on board. The biggest challenges in using this cleaner, more abundant fossil fuel is that, even when compressed, it stores less energy per unit volume than gasoline. So the specially designed compressed natural gas tank is more expensive, heavier and larger, yet still delivers a smaller driving range and requires more time to refill. The advantage is that emissions of all air pollutants are substantially reduced and engine life is extended because the fuel is so clean. So natural gas-powered cars and trucks are a viable option, but electricity seems to be beating it out as the successor to gasoline.
Natural gas is currently at the center of an energy and environment controversy over fracking as depicted in the 2012 film Promised Land. Early in the 21st century, petroleum engineers working the Barnett Shale around Dallas, Texas, found a way to marry the decades-old technique of fracturing shale using hydraulic pressure to increase permeability in a petroleum field with the new techniques of horizontal drilling. This technological revolution started the shale gas boom, which soon spread to the enormous Marcellus Shale play stretching from New York to Kentucky, with the heart of the action in Pennsylvania. Domestic natural gas supplies increased, reducing prices. Plans for importing liquified natural gas (LNG) were replaced with proposals to export it as reserve estimates sky-rocketed. Is this shale gas boom good or bad for natural resources sustainability?
Environmental groups are opposing fracking due to its demonstrated environmental risks. First is contamination of groundwater with natural gas or fracking fluid, usually from poor, leaky well casings. Second is possible release of methane, a powerful greenhouse gas, into the atmosphere. Third is potential release of fracking fluid into surface water and high rates of water use. Fourth is the uncertainly over earthquakes induced by fracking operations.
On the plus side, natural gas burns cleaner than the coal it is replacing in the electricity market. U.S. greenhouse gas emissions may have peaked, partly due to gas replacing coal. Its peaking power flexibility complements efforts to increase intermittent wind and solar power.
I find myself on the side of tightly regulating, but not banning, fracking because its benefits are essential—every realistic evolution toward energy sustainability I can envision employs gas as a key transition fuel through the mid-21st century. While the environmental risks are real, they are borne of carelessness that can be remedied through thoughtful, strict regulations. This should be federal, by reversing the Halliburton loophole in the Safe Drinking Water Act but is now occurring on a state-by-state basis. Regulation of fracking is an active field of play in environmental policy.
Nuclear Fission
Nuclear power is based on atomic fission, where radioactive elements, in this case uranium, spontaneously emit high-energy neutrons from their nucleus, releasing enormous quantities of energy. These neutrons in turn can split or fission the nuclei of other uranium atoms, causing more neutrons to be emitted, which in turn cause other nuclei to fission in a chain reaction, or positive feedback process. In the 1940s, Robert Oppenheimer led the secret Manhattan Project at Los Alamos, New Mexico, which applied the fission process to produce the nuclear bombs (named Fat Man and Little Boy, also the title of an interesting movie about the Manhattan Project) that were dropped on Hiroshima and Nagasaki, Japan in August 1945, killing hundreds of thousands of civilians but also ending WWII. An interesting start for an energy source.
Subsequent scientific research in the 1950s and 1960s found a way to control the chain reaction by absorbing just the right amount of neutrons in graphite rods so that it produces large amounts of heat energy to boil water to spin electrical turbines, without spiraling into a radioactive explosion. The U.S. built about 100 nuclear power plants for several billion dollars each from 1963 to 1983. The plants have performed remarkably well and currently supply 19 percent of U.S. electricity.
On March 28, 1979, the Three Mile Island nuclear power plant near Harrisburg, Pennsylvania, had an accident involving the loss of coolant and small amounts of radioactive gases were released, but still far less than the release of radioactivity from a typical coal-fired power plant. It was a close call. Seven years later on April 26, 1986, the Chernobyl Nuclear Power Plant in Ukraine, then part of the declining Soviet Union, had a far worse accident when the nuclear reaction ran out of control, ironically during a safety test, causing the power plant to explode, killing 56 people. With no containment building to hold in the radioactive gases, the accident released 400 times the radioactive fallout of the Hiroshima bomb over large areas of the Soviet Union and Europe and forced the permanent evacuation of 336,000 people. Estimates vary, but 600,000 people were exposed to radiation and perhaps 4,000 subsequently died of cancer. Following these two incidents, the American public turned against nuclear power and no plants have been built since 1983. The high costs of building nuclear plants and the lack of a solution for disposing of spent nuclear fuels have also contributed to the cessation in nuclear power plant construction.
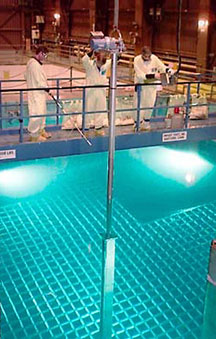
Spent uranium, control rods, and other materials from the core of nuclear reactors constitute high-level radioactive waste. A nuclear power plant typically produces less than 100 pounds of high-level radioactive waste per year because a uranium pellet the size of the tip of your finger has the energy content of a ton of coal. Currently, most of the 57,000 tons of accumulated waste, enough to cover a football field about five yards deep, is stored at the power plants in steel and concrete-line pools of water (Figure 14.13). Whether for or against nuclear power, most scientists agree that the waste would be more safely stored in a geologic repository after it cools for a few years to a few decades at the power plant sites.
An application to store all this waste below Yucca Mountain, Nevada was submitted by the Department of Energy to the Nuclear Regulatory Commission, but its chances of being approved are nearly zero. It is the #1 NIMBY issue in the U.S. The site is not geologically ideal and lies thousands of miles from most of the existing power plants, which are in the populous Great Lakes, Mid-Atlantic, and Upper South regions near large sources of water for cooling the power plants (Figure 14.12). The distance issue is important because analysis shows that the most dangerous phase in handling nuclear waste occurs during its transport by rail or truck from temporary to permanent disposal.
Some perspective is required here, however. In the Cold War with the Soviet Union, the U.S. produced at least 30,000 nuclear weapons. According to the Department of Energy’s Office of Environmental Management, these programs generated more than 1.5 million cubic meters, several million tons, of solid radioactive waste and 88 million gallons of radioactive liquid waste, enough to fill the Superdome in New Orleans. So we have about 100 times as much high-level nuclear waste to deal with from the military as from civilian nuclear power plants. An area larger than Delaware spread among 35 states requires cleanup.
The Office of Environmental Management has safely transported and placed 100,000 containers of high-level radioactive waste 2,000 feet underground in a stable geologic formation at the Waste Isolation Pilot Plant near Carlsbad, New Mexico. Perhaps this and other sites for military nuclear waste disposal present a ready solution to the waste problem from nuclear power. In the meantime, there is room at power plants for a few decades more waste, but it is time to resolve the disposal issue.
So here are my grades on nuclear power: a C for cheap, given the large capital costs for building the plants, despite low fueling costs, a B for clean, given that nuclear plants emit almost no air and water pollutants but do generate toxic waste. A controversial C for safety, given the industry’s outstanding safety record (despite the dicey situation at Three Mile Island decades ago), and the potential for a solution to the nuclear waste problem. I’ll give it a B for being well-understood, which it is, but it also involves the most complex engineering and safety issues in the energy field. A C because you can only power an electric car with a nuke. It produces electricity but gets a B because nukes cannot be turned on and off flexibly to produce peaking power like gas plants can.
Finally nuclear gets an A for being a domestic source of electricity running on uranium, a mineral with a large reserves-to-production ratio that is potentially recyclable. There is a trade-off here: without reprocessing of nuclear fuel, stocks of uranium are used up faster, but reprocessing and breeder reactors conserve uranium at the expense of producing weapons-grade plutonium. I’d favor using up more uranium to minimize risks of nuclear proliferation.
An intriguing option for nuclear power lies in an element slightly lighter than uranium: thorium. A half-century ago, the U.S. selected the uranium-based over the thorium-based approach to nuclear power because it can help produce nuclear weapons materials—precisely the technology’s greatest drawback today. And thorium-based technologies use up rather than generate nuclear waste. A nuclear fission plant in Norway has successfully replaced uranium with thorium. Google “thorium-based nuclear energy” and see whether you think it is a viable option for sustainable energy.
Advanced Small Modular Reactors are another option under development at Idaho National Laboratory and elsewhere. Their modular form provides flexibility in size and location so that power capacity can be added incrementally, reducing financial risk and serving remote locations. Like gas, they can be turned on and off quickly to balance the grid against variable output from wind and solar power plants. They employ passive safety features and may also generate far less nuclear waste. As a carbon-free source of electricity, this technology has the potential to be part of a sustainable energy future.
Oil
Oil has never been an icon of environmental sustainability. Let’s remember, however, why oil has been a preferred energy source for a century. It’s safe and easy to transport and handle because it’s a liquid that doesn’t explode and won’t kill you if a little splashes on your skin (don’t drink a glass of it though). It has a high energy content for its weight and volume so that the two cubic foot gas tank in your car or truck filled with 100 pounds of gasoline sends you 300 miles down the road. This is especially important for airplanes that will need oil as a fuel even after everything else has adapted to doing without it.
About three-fourths of oil use is in vehicles and the remainder is residual fuel oil (what’s left of the crude oil after the better parts are made into gasoline, diesel, and jet fuel), which is used in industry and for home heating. So the key to reducing oil use is to design cars and trucks to run more efficiently, to run on something else, or to replace them with a different kind of vehicle.
Electricity has emerged in the last few years as the clear heir apparent to gasoline. Widely available for over a decade, hybrid cars generate electricity on board through braking and store it in a nickel metal hydride or a lithium-ion battery. This augments the power from the gasoline engine, giving the vehicle about a 40 percent boost in gasoline mileage.
Plug-in hybrid vehicles have become common on the market since about 2015. Most use a lithium-ion battery that can power the vehicle for 20–30 miles or complement the gasoline engine increasing gas mileage (and acceleration) substantially. My Toyota Prius Prime is averaging over 80 miles per gallon, including charging it from my solar panels (that’s right, I’m drivin’ on sunshine). Going to work or running errands around town, it runs completely on electricity obtained by plugging it into a regular outlet in the garage. Tesla made fully electric cars (EVs) popular among those who can afford one by expanding the driving range to over 200 miles and opening charging stations throughout the country. Most major car companies have now released or have made multimillion dollar investments to produce EVs by the early 2020s. Some auto companies have declared EVs the winner and the internal combustion engine the loser in this high-stakes technological race. EVs, we must remember, are only as green as the grid from which they draw their power. As we saw above, the replacement of coal with gas, wind, and solar is steadily achieving the goal of making the grid much greener than oil—and cheaper, with electricity costs averaging about $1/gallon.
Even partial electrification of automobiles has considerable advantages because it expands energy options. Clean coal, hydro, wind, solar, shale gas, and nuclear power can all propel an electric car. None of them can propel your liquid fuel automobile, which can only run on gasoline, perhaps mixed with ethanol from biofuels. It is also possible to capture and store carbon emissions from a power plant but not from a tailpipe.
Solar Energy
Solar energy strikes the Earth at a rate thousands of times greater than humans’ current generation of energy, making it an enormous perpetual energy source. Passive solar is an underrated source of energy through efficiency by making better use of sunlight as an environmental service. For example, a large deciduous tree on the south side of a house reduces air conditioning costs in summer by shading the roof, but it allows sunlight through the windows in winter when sun angles are lower and the leaves have fallen. Special heat-rejecting window glazings and daylighting—designing interior spaces and windows to make best use of sunlight—can be worked into architectural designs to eliminate nearly all need for artificial light when the sun is up.
The real solar revolution, however, is in active solar, primarily photovoltaics, which directly transform solar energy into electric current. Like wind but following about a decade on its heels, the rapid reduction in cost of production has been a key to the sustainable energy revolution now underway. The cost per watt of solar photovoltaic energy produced has fallen from $76 in 1977 to $4 in 2000 to $0.25 in 2017. (A book entitled How Solar Energy Became Cheap came out in 2019 telling us how this happened). This fact alone should convince you that we are indeed in the midst of a sustainable energy revolution. Thinking back to Chapter 6, this is a rightward shift (i.e., increase) in the supply curve that, reviewing now, has what effects? A decrease in price, an increase in quantity, and an increase in consumer surplus.

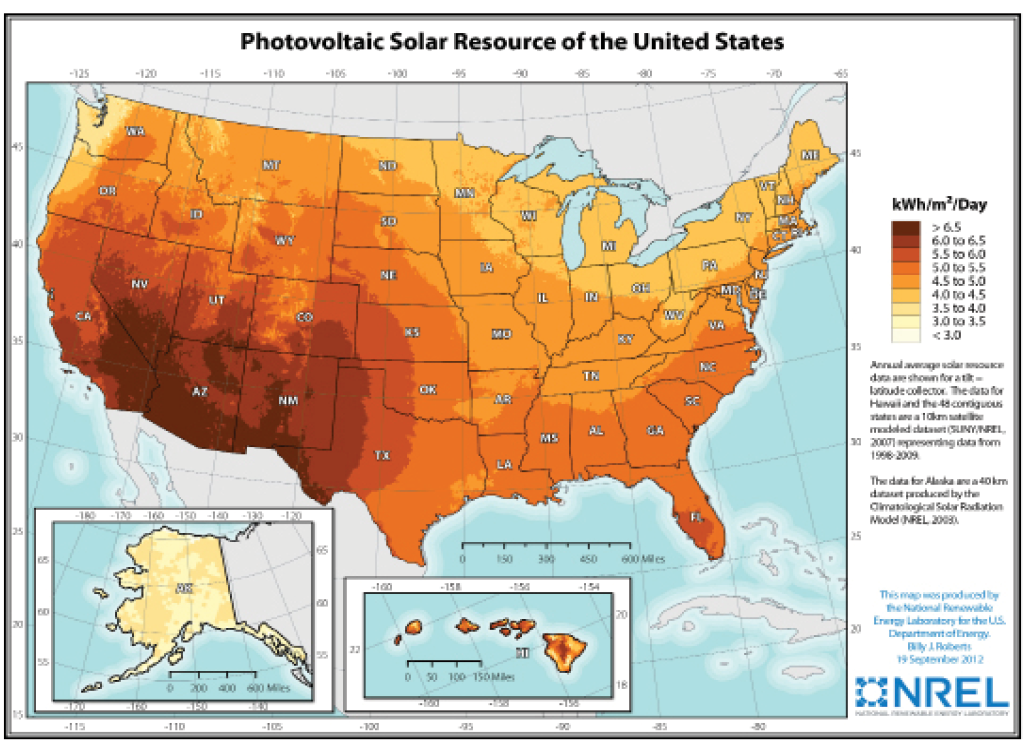
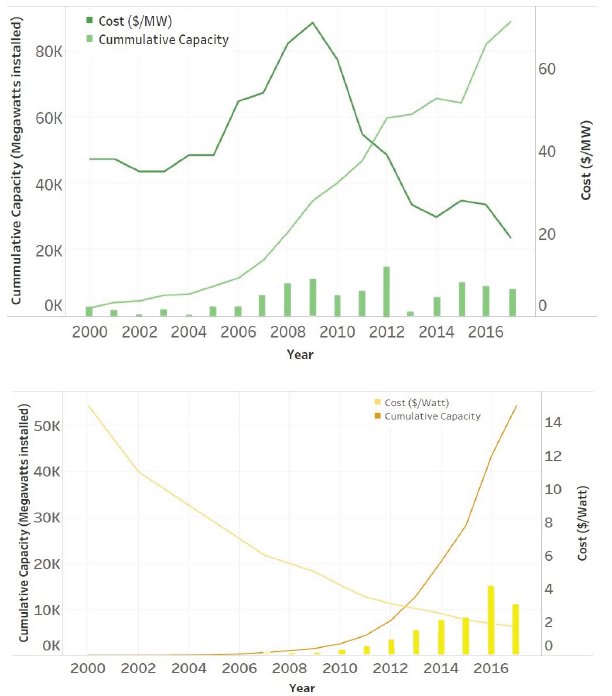
Figure 14.15 captures the fundamental relationship between the decline in the cost of wind power and then solar power, and how, once they cross a threshold of being cost-competitive with traditional sources like coal and gas, deployment grows exponentially. This is at the heart of the sustainable energy revolution.
Conclusions
Even a half-dozen years ago, the kind of progress in sustainable energy displayed in Figure 14.15 seemed out of reach. Instead there was a list of hoped-for technological breakthroughs from geothermal to hydrogen gas to cellulosic biofuels to the real sci-fi panacea—nuclear fusion, the source that powers the sun. Yet, the breakthroughs in wind and solar achieved in the last decade, together with the anticipated electrification of vehicles, seem to make these technological drives important but more secondary than they seemed a few years ago. Of course, even after technological problems are solved in an engineering sense, there is still the task of implementation: build and maintain the wind and solar farms, install solar panels, build EVs, and trim the darn trees away from the power lines. But that just means jobs, jobs, jobs.
We fortuitously find ourselves in a much better position relative to achieving energy sustainability than we could have hoped at the turn of the century. Wind and solar are not only essentially free of greenhouse gas emissions, they are free of other air pollutants and, importantly, do not place great demands on water resources. And they can be produced in large quantities in a cost-effective manner, replacing even gasoline in electric vehicles. The primary technological hurdle that remains to be climbed is electricity storage or, more broadly defined, syncopating electricity production with electricity consumption. The better we can solve that problem, the less we need to rely on natural gas, largely obtained through fracking, to keep the grid in constant balance. Meanwhile, gas remains the workhorse of the heating sector and is thus a critical transition fuel.
Of course, there are policy hurdles to be climbed as well if this sustainable energy revolution is to come into force in the next few decades rather than the next several. It is to policy then that we turn our attention in Chapter 15.
The Energy Simulation
The primary goal of the energy simulation is to design an energy plan for the U.S. through 2050 that is able to meet four objectives: (1) supply U.S. energy needs in three sectors (electricity, vehicle fuel, and heating), (2) within a budget, (3) while reducing reliance on oil, and (4) reducing greenhouse gas emissions. Students improve their understanding of where their energy currently comes from, and how, with new possibilities brought about by technology, these sustainability problems can be addressed in the future. The simulation (available at Weidong’s Projects Homepage) is played by adding energy options in units of quads (quadrillion British thermal units) to meet future energy needs, within a budget, in 2020, 2030, 2040, and 2050. Each energy option within a sector has a limit on its energy production potential and, therefore, on the number of quads. Additional limits can be placed on oil consumption or greenhouse gas emissions, reflecting climate change mitigation. The simulation is thus a challenge of meeting multiple objectives simultaneously at different levels of difficulty. From very easy through very hard, the budget decreases while the energy requirement increases; thus, the range of energy choices that fulfills the multiple objectives diminishes as difficulty level increases.
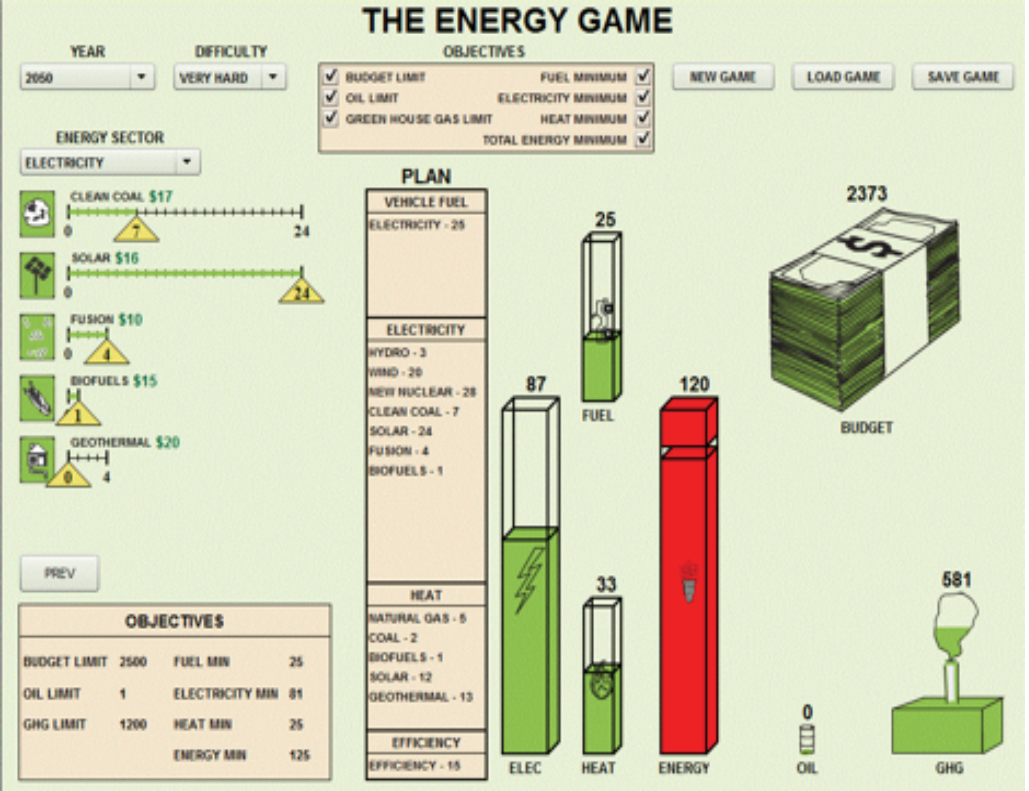
Students play the simulation by adding units to energy options within each sector using a slider bar in one quad units up to the capacity constraint. As they do so, all of the graphs on the right-hand side of the user interface (Figure 14.16) change, reflecting impacts on energy produced, money spent, oil consumed, and greenhouse gases (GHGs) emitted. Graphs for satisfied objectives are green whereas those for unsatisfied objectives are red. Students may find that satisfying (turning green) one objective (e.g., total energy or electricity supply) turns another red (e.g., budget or GHG). They then make adjustments until all objectives are satisfied.
Through the simulation, students learn not only the different sources of energy, but their relevance to specific sectors of the energy system. For example, vehicle electrification increases demand for electricity, but the provision of electricity has more options. Students learn that all energy needs must be met but that resource and environmental constraints cannot be violated. And it all must be done in an economical way. Nonetheless, this can be achieved.
Further Reading
Bakke, G., 2016. The Grid: The Fraying Wires Between Americans and Our Energy Future. New York: Bloombury.
Interacademy Council, 2007. Lighting the Way: Toward a Sustainable Energy Future. Amsterdam, The Netherlands.
Yergin, D., 2008. The Prize: The Epic Quest for Oil, Money and Power. 2nd edition. Simon and Schuster, New York.
Media Attributions |
|

