2.6 Visual Diagrams
Rachel Cox-Vineiz, MA and Erin Thomas, MFA
The Power of Visual Note-Taking
Tired of staring at pages of endless text, feeling like the information just isn’t sticking? Visual note-taking (or graphic visualization, visible thinking, or sketch-noting) is a powerful alternative. It combines words and visuals to help you record information in a way that makes sense to you, leading to better understanding, improved memory, and a more engaging learning experience. It’s about capturing the essence of the material, not trying to transcribe every single word. Think of it as creating a personalized, visual map of the information.
Why Go Visual? The Benefits of Visual Note-Taking
- Boosts Memory and Retention: Our brains are wired to process visual information more effectively than plain text. Images, colors, and spatial arrangements create stronger memory links.
- Enhances Engagement and Focus: Visual note-taking is an active process. It requires you to be actively involved in synthesizing and organizing information, making learning more interesting and helping you stay focused.
- Clarifies Connections and Relationships: Diagrams, arrows, and other connectors make it easy to see how different ideas relate to each other. This is especially helpful for complex topics.
- Personalized Learning and Understanding: You create notes that resonate with your unique learning style and thought processes. This makes the information more meaningful and easier to recall.
Key Elements of Effective Visual Notes
- Keywords and Phrases: Instead of writing out full sentences, focus on the most important words and short phrases that capture the core meaning.
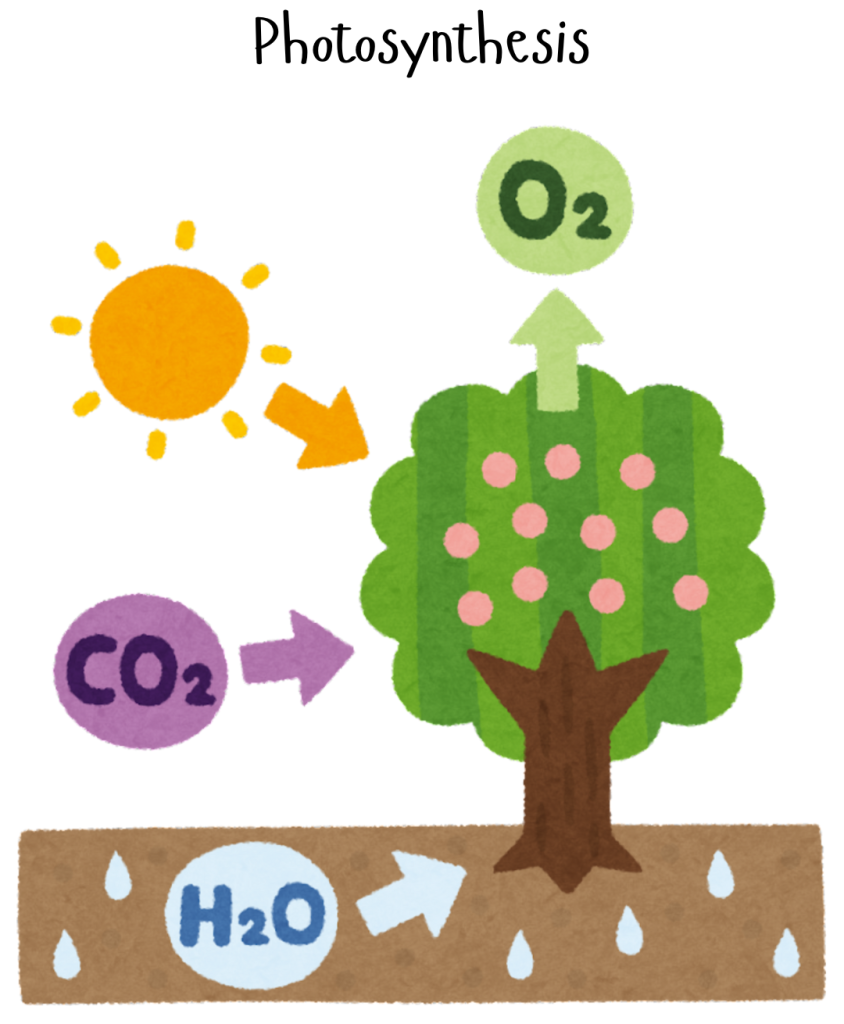
- Images, Icons, and Symbols: Simple drawings, icons, or symbols can represent complex concepts quickly and effectively. Don’t worry about artistic skill – stick figures and basic shapes are perfectly fine!
- Connectors and Relationships: Lines, arrows, branches, and other visual connectors show how different ideas relate to each other. Use different types of connectors to indicate different types of relationships (e.g., arrows for cause-and-effect, lines for supporting details).
- Color and Emphasis: Use colors strategically to highlight important information, categorize different concepts, or add visual interest.
Different Techniques
There are multiple options for visual note-taking. Choose the one that works best for you and your subject matter.
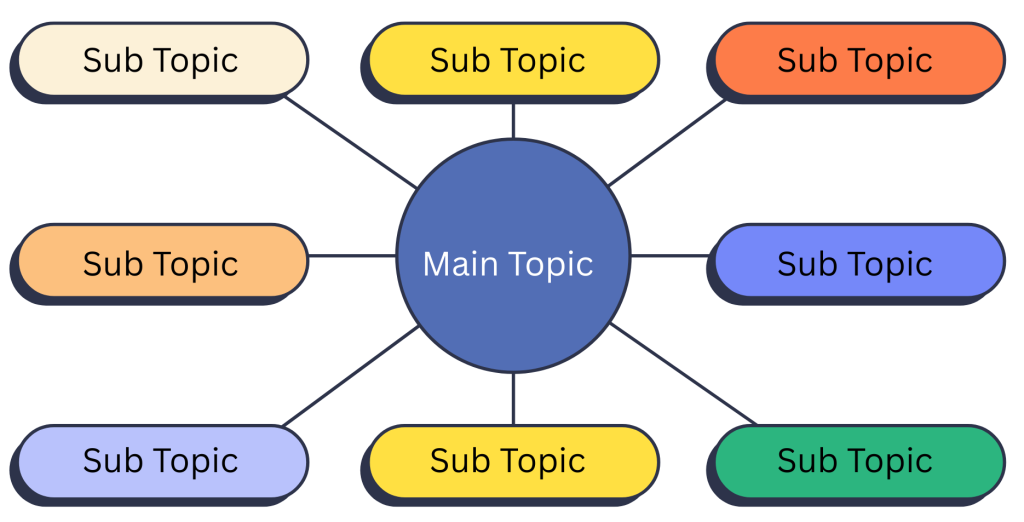
Mind Maps
Start with a central idea and branch out to related concepts. This strategy can be useful for brainstorming a paper, studying for exams (ideal for subjects like biology, history, psychology, sociology, etc.)
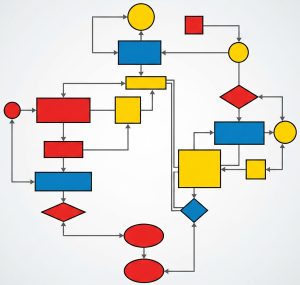
Flow Charts
Visualize the flow of a process or event step by step, leading to its outcome. Flow charts are a dynamic and structured way of taking notes that help students track sequences, processes, and relationships. Unlike traditional linear notes, flow charts visualize how ideas move, making them especially helpful in college classes that focus on cause-and-effect, step-by-step instructions, decision-making processes, or organizational structures.
Flow charts are perfect for subjects that involve clear processes, such as:
-
Biology: stages of mitosis, digestion, or the immune response
-
Psychology: stages of cognitive development or conditioning
-
Political Science: how a bill becomes a law
-
Business/Marketing: decision-making processes or customer journeys
-
Computer Science: logic flow and algorithm design
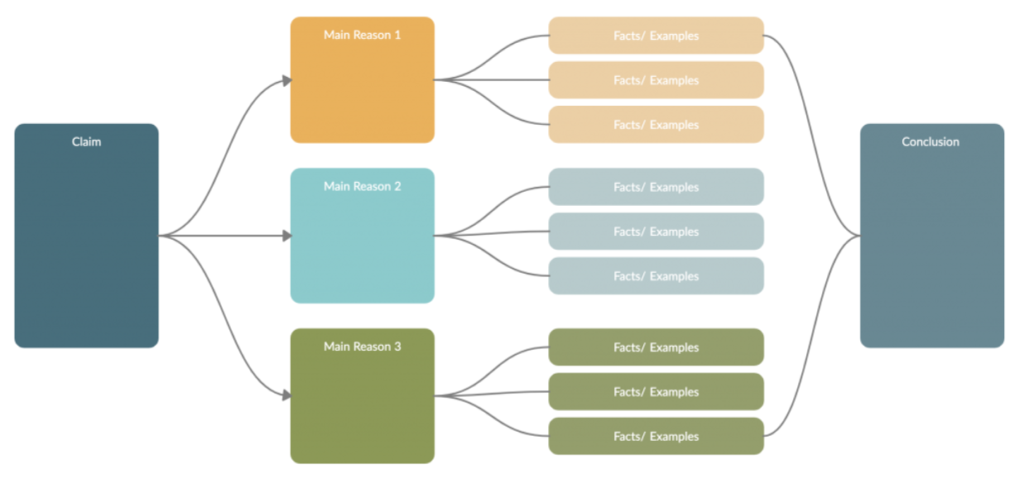
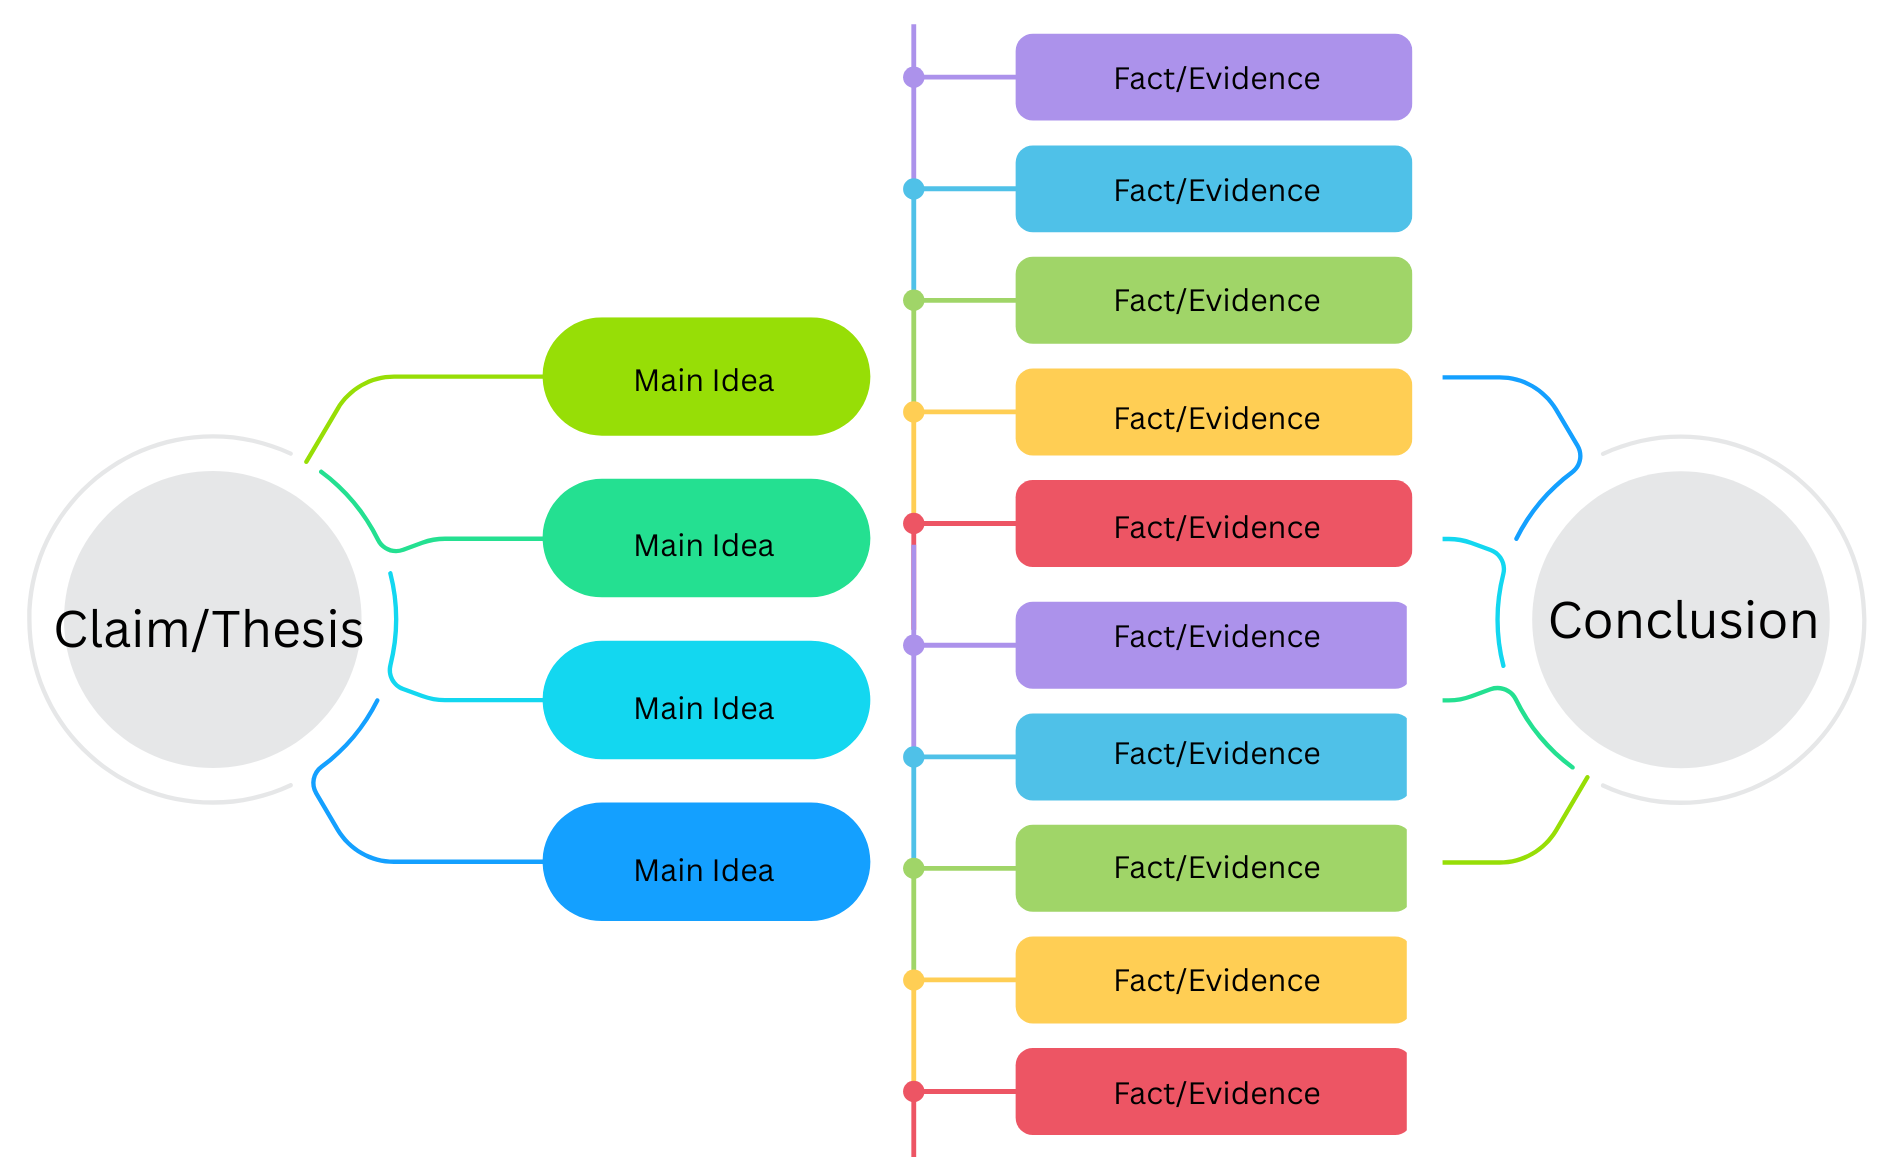
Graphic Organizers
Visual note-taking helps you easily grasp and remember information. It combines text, shapes, and connectors to simplify ideas and show how they relate.
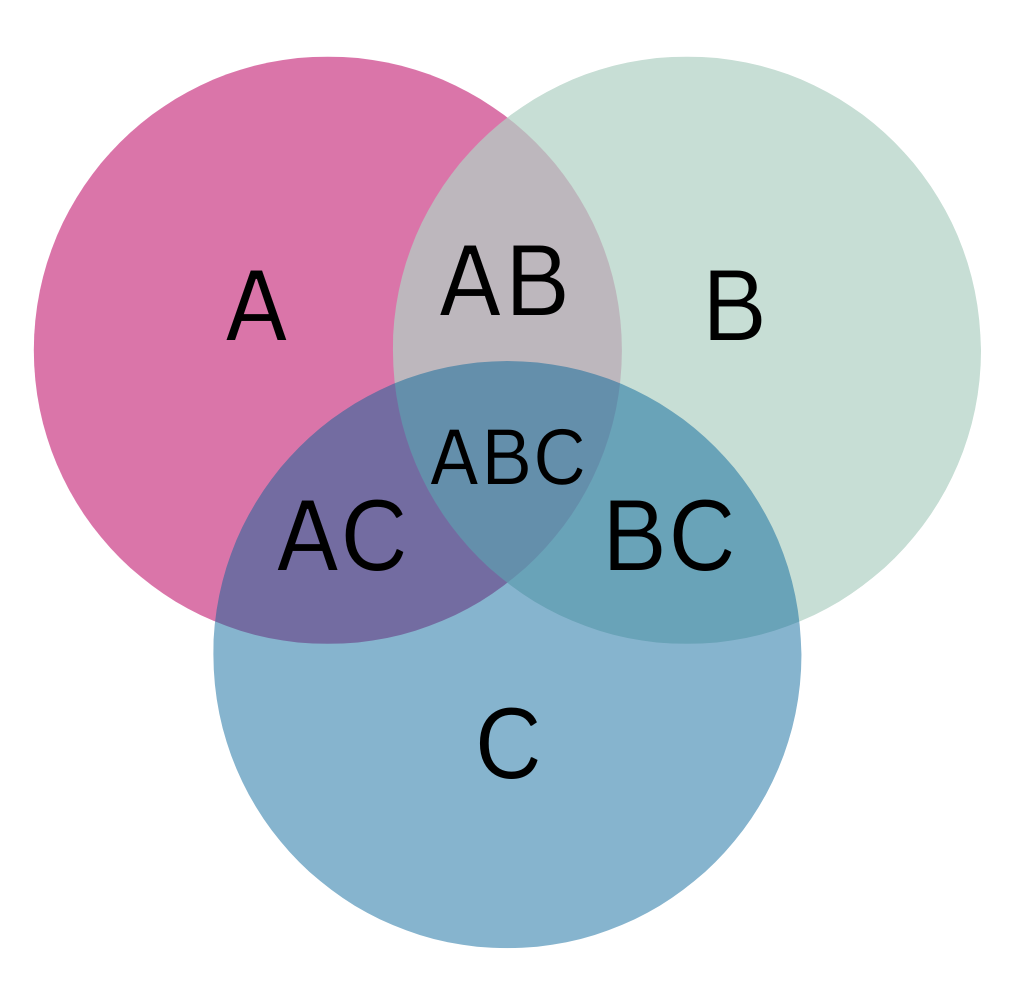
Venn Diagrams
Compare ideas, concepts, or items. At a glance, they reveal the differences and similarities between or the characteristics of two or more things. Use Venn diagrams or T-charts to analyze similarities and differences between:
-
Historical events or figures
-
Theories or approaches (e.g., Freud vs. Jung, capitalism vs. socialism)
-
Literary themes or characters
-
Perfect for humanities, history, political science, or comparative literature.
Getting Started: A Step-by-Step Approach
- Listen/Read Actively: Pay close attention to the material and identify the main ideas, supporting details, and key terms.
- Capture Keywords and Phrases: Jot down the most important words and short phrases that represent the core concepts.
- Visualize the Information: Think of simple images, icons, or symbols that could represent the ideas. Don’t overthink it – even simple doodles can be effective.
- Connect Related Concepts: Use lines, arrows, and other connectors to link related ideas together. Show the relationships between them.
- Organize Your Notes Visually: Structure your notes in a way that makes sense to you. Experiment with different layouts to find what works best for different types of information.
Visual note-taking is a skill that develops with practice. Don’t worry about being an artist or creating perfect notes. The goal is clarity, personal understanding, and active engagement with the material! Experiment with different techniques and find what works best for you.
Instructions
- Select part of a chapter from a textbook you are using in another class or use the sample text, “The Election of Franklin D. Roosevelt” in 3.6 Supporting Details and Transitions.
- Power tip: If you are using a math book, consider using the following method to map the information:
- Write a sample problem in black. Define all the mathematical symbols with colored marker (this will require you to look them up in your book/Internet). Write step by step instructions to completing the problem.
- Power tip: If you are using a math book, consider using the following method to map the information:
- Buy a large piece of poster board and some large markers.
- Map the text using one of the visual diagram types explained above, or pick your own system. Note that you can doodle on your visual maps too!
- Take a picture of your poster mapping a textbook chapter.
- Hang the poster on a wall where you will see it often. Glance at it as you go about your day to save time studying.
Media Attributions
- Notes comparison © Rachel Cox-Vineiz is licensed under a CC BY-NC-SA (Attribution NonCommercial ShareAlike) license
- Photosynthesis © Rachel Cox-Vineiz is licensed under a CC BY-NC-SA (Attribution NonCommercial ShareAlike) license
- Mind Map © Rachel Cox-Vineiz is licensed under a CC BY-NC-SA (Attribution NonCommercial ShareAlike) license
- Flow Chart © Rachel Cox-Vineiz is licensed under a CC BY-NC-SA (Attribution NonCommercial ShareAlike) license
- Graphic Organizer © Rachel Cox-Vineiz is licensed under a CC BY-NC-SA (Attribution NonCommercial ShareAlike) license
- Venn Diagram © Rachel Cox-Vineiz is licensed under a CC BY-NC-SA (Attribution NonCommercial ShareAlike) license
