Effect of Three Classroom Research Experiences on Science Attitudes
Lauren K. Lucas, Ph.D.; Frances Kate Hunter; and Zachariah Gompert, Ph.D.
Abstract
Here we evaluate undergraduate student attitudes about science after each of three authentic research experiences in a semester of an introductory biology laboratory course at Utah State University. The three course-based research experiences (CUREs) vary in length and student freedom, and they cover different areas of biology. Students responded to the science attitude items of the CURE Survey. When compared to national data, our students faired similarly, and all students struggled with certain epistemic assumptions about science knowledge. As also seen in the national database, change in science attitude was slight and nonlinear. Student self confidence in what a career scientist is and in scientific process skills was the best predictor of scientific maturity, not the three CUREs or other aspects of students’ background. We discuss the slight positive and negative change in attitude we did influence, and we note that most students would choose to have another research experience.
Keywords: CURE, undergraduate students, introductory biology
Background
Over the last decade and as a result of calls for reform in undergraduate biology education, many universities have updated their scientific laboratory courses to emphasize course-based undergraduate research experiences (CUREs; Auchincloss et al., 2014). CUREs replace “cookbook” laboratory exercises in which students can guess or figure out the result(s) before conducting the exercise. Instead, CUREs help students fill real gaps in our scientific knowledge, as practicing scientists do. Thus, during a CURE, students experience all or some of the process of science: reading and evaluating the scientific literature, asking authentic questions, selecting the appropriate methods, collecting and analyzing data, interpreting and disseminating results, and working collaboratively. This authentic experience means that the students’ work has meaning beyond the particular course. CUREs fit under the umbrella of situated-learning theory, which proposes that learning involves a group of people working on a common problem and using a common set of practices, where learning is doing and belonging (Lave & Wenger, 1991).
Studies have looked at the benefits of CUREs (e.g., Denofrio et al., 2007; Kowalski et al., 2016; Flaherty et al., 2017a). CUREs allow all students to participate in authentic research, not just high-achieving or upper-division STEM college majors with internships. This way, students who have not declared their major can experience authentic research, and the early-on experience may help retain students in the STEM fields (Harrison et al., 2011). The experience might be a first encounter in taking responsibility for their own learning (Lopatto & Tobias, 2010), and a sense of ownership can contribute to their persistence in science (Hanauer et al., 2012). CUREs can help students self-identify as a scientist and improve their understanding of science as creative and process-based (Russell & Weaver, 2011; Indorf et al., 2019). A general finding is that students in a research-like science course report learning gains that resemble those reported by students in dedicated research experiences, with the magnitude of these gains falling between the higher ratings of undergraduate researchers and the lower ratings of students in more traditional courses (Lopatto & Tobias, 2010).
Current need
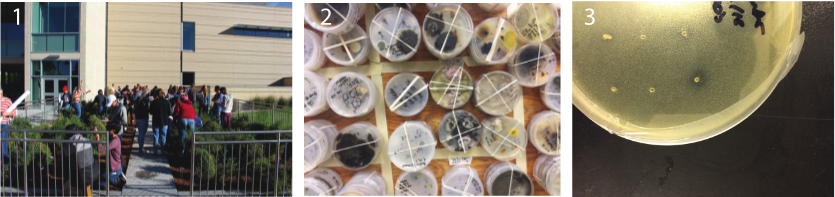
In 2016, we updated the undergraduate-level Biology I Laboratory course at Utah State University (BIOL 1615 at USU) by replacing prescribed exercises with three CUREs. Now, students practice discovery-based (descriptive) science in this course (students gain experience with hypothesis-driven science in the second semester of the introductory biology lab course series, Biology II Laboratory). Nationwide, there are: 1) multisite CUREs in which data collected by students across institutions feed into a national database, such as the SEA-PHAGES program (Hanauer et al., 2017), and 2) projects led by individual instructors. Our CUREs are a mixture of both, and we refer to them with the following names: science garden (CURE 1), endophyte diversity (CURE 2), and bee immune systems (CURE 3) (Figure 1). After practicing descriptive science during short stand-alone guided inquiry projects the first few weeks of the semester, students participate in the first CURE. During one class session, students work on a long-term project in the Dr. Gene Miller Life Science Garden Laboratory in which they measure plant traits and quantify changes across populations over time. CURE 1 is based on and uses the plants from a funded, National Science Foundation (NSF) project led by Z. Gompert. The week after CURE 1, students start CURE 2. In CURE 2, students discover fungal endophytes growing in plant tissue on campus and discover the evolutionary relationships among them. This project was adapted from Bascom-Slack et al. (2012). Students choose which plant tissues to sample from after exploring what is known in the scientific literature and thereby what gaps still need to be filled. CURE 2 runs for seven weeks and is directly followed by CURE 3. In one class session, students quantify the immune response of native bees from Panama to test a hypothesis regarding life history trade-offs, designed by a resident graduate student, F. K. Hunter. In Table 1, we list the inquiry characteristics of each experience. All three experiences are inquiry-based and authentic, because the results are not known upfront and the research is relevant to the scientific community, respectively. The amount of freedom students have to make decisions about the project varies, with CURE 2 giving students the most freedom. Across the country, CUREs have been developed around faculty research, but most focus on one research area (but see Indorf et al., 2019). Our series of CUREs exposes students to multiple areas of biology: population biology, systematics, and animal behavior. We view applying the scientific process to different areas reinforces research skills and students’ understanding of the process of science. Furthermore, if students do not connect with one research area, they may appreciate another.
| Inquiry characteristics | CURE 1: Science Garden | Cure 2: Endophyte Diversity | Cure 3: Bee Immune Systems |
|---|---|---|---|
| Question type | Novel | Novel | Novel |
| Source of the question | Given by instructor | Open to student (who uses the scientific literature) | Given by instructor |
| Data collection methods | Given by instructor | Given by instructor | Given by instructor |
| Analysis of data | Open to student | Given by instructor | None |
| Iteration of scientific process | Students analyze previous years’ data | Students critique one another’s work | Students use a graduate student’s hyptohesis |
| Tye of equipment used | Advanced (e.g., InsectaZooka) | Advanced (e.g., DNA sequencing) | Advanced (e.g., zone of inhibition assay) |
| Data quality | Potentially publishable | Potentially publishable | Potentially publishable |
| Presentation of results | Reflection submitted to instructor | Peer-reviewed lab report | None (graduate students uses the raw data) |
| Length of project | 1 class session | 7 class sessions | 1 class session |
We have had an updated BIOL 1615 curriculum for four years. Here we make an important first step in assessing the CUREs in this course. We address the following questions: 1) How do our students’ attitudes about science compare to average attitudes nationwide?, and 2) How are attitudes affected by each CURE within this one-semester course? Most past studies conducted a single pre and post-course survey, whereas we conducted a pre-course survey and one survey after each of the three CUREs. Checking in with student attitudes multiple times in a semester could be enlightening. As attitudes can be affected by other factors, such as family background, age or grade level, and gender (Perera et al., 2017), we also look into some other factors, besides the CUREs, that might explain student attitudes about science.
Methods
The institutional review board of USU approved the procedures of this study (IRB #10534).
The course context
In the fall 2019 semester of BIOL 1615, there were 884 students enrolled in 39 lab sections, with a maximum of 24 students per section. There were 16 graduate teaching assistants (GTAs) that taught the lab sections. Most GTAs taught three lab sections. A lab coordinator, L. K. Lucas, trained the GTAs in general scientific teaching practices and lab project logistics during an hour per week. The course met 2.75 hours per week. Students were in semester-long groups of three or four. Each group had their own table where they faced each other to facilitate collaboration. Each week, students were asked to read the lab manual and complete a pre-lab quiz to prepare for class. Students received a brief in-class presentation by their GTA to emphasize background information commonly missed on the pre-lab quiz, safety rules, and complicated procedures.
The survey: informed consent
We conducted four surveys: the pre survey, the post CURE 1 survey, the post CURE 2 survey, and the post CURE 3 survey. Each survey started with an explanation of the purpose of the project and the informed consent (Supplemental Information: Methods). The consent explained that participants were required to be at least 18 years of age and participation was voluntary and anonymous. The incentive for participation was a raffle for each of the four surveys. Four raffle winners total were each given a $25 Amazon gift card. We created our surveys in Qualtrics. We created “anonymized raffles” with the “anonymize response” option to remove all personal data, including IP address. If a student agreed to entering the raffle, they entered an email address. Only F. K. Hunter had access to the email addresses. She randomly chose one email address for each of the four surveys using the ‘randomNames’ package in R. The pre survey was available to students the week of September 9, 2019. The post CURE 1 survey was available to students the week of September 23, the post CURE 2 survey was available to students the week of November 25, and the post CURE 3 survey was available the week of December 9.
The survey: content
Most studies reporting assessment of CUREs in the life sciences have made use of the Classroom Undergraduate Research Experiences (CURE) Survey (Lopatto, 2007; Lopatto & Tobias, 2010). The CURE survey has thus far been administered to more than 10,000 students at 122 different institutions nationwide. We adopted parts of it for our study because this wide use affords us a strong comparison with other courses and programs. There are other science attitude surveys in the literature but have less representation: the Views about Sciences Survey (Halloun & Hestenes, 1996) and the Views on Science and Education Questionnaire (Chen, 2006), for example. First, students answered questions about their background: gender, ethnicity, status in school, major, whether they had participated in research before this course, and current plans post-undergraduate degree. Next, we asked students for their perceptions of their performance on aspects of the process of science (originally derived from other well-known surveys such as the CIRP Freshmen survey; Astin, 2003).
Last, students responded to a series of Likert-type items regarding their attitudes toward science, originally written by Wenk (2000). The items were designed to be balanced between negatively and positively structured (that is, whether agreeing or disagreeing constitutes the more complex thinking). Some of the questions were specifically written to: 1) address epistemic assumptions about science knowledge, which range from believing knowledge can be known concretely to understanding knowledge is created in context and is subjective, 2) address methods of justifying decisions, and 3) get a sense of the degree to which individuals see themselves as exerting power or control in creating scientific meaning or of being in control of their learning in science (also known as students’ sense of agency with regard to science). Table 2 lists the 22 attitudes about science items, the known justification for the question, and the answer expected for a “scientifically mature” student, according to Wenk (2000). The three post CURE surveys included two questions at the end: one that asked if they would choose to have another research experience, and the other asked for comments regarding how the specific CURE affected their attitude about doing science. We decided not to use the part of the CURE Survey that relies on student perceptions of their own skill gains, as we worry about overconfidence in self-reporting (Kardash, 2000).
| Order | Item | Justification | Expected answers | PC1 loadings | CURE 1 | CURE 2 | CURE 3 |
|---|---|---|---|---|---|---|---|
| 1 | Even if I forget the facts, I’ll still be able to use the thinking skills I learn in science. | sense of agency | + | 0.17 | 🗷 (-0.34; 0.009) | ||
| 2 | You can rely on scientific results to be true and correct. | epistemic assumptions | – | 0.04 | |||
| 3 | The process of writing in science is helpful for understanding scientific ideas. | + | 0.15 | ||||
| 4 | When scientific results conflict with my personal expereince, I follow my experience in making choices. | methods of justifying decisions | – | -0.19 | 🗹 (-0.26; 0.03) | ||
| 5 | Students who do not major in science should not have to take science courses. | sense of agency | – | -0.27 | 🗷 (0.29; 0.05) | ||
| 6 | I wish science instructors would just tell us what we need to know so we can learn it. | – | -0.36 | ||||
| 7 | Creativity does not play a role in science. | epistemic assumptions | – | -0.28 | |||
| 8 | Science is not connected to non-science fields such as history, literature, economics, or art. | – | -0.30 | 🗷 (0.28; 0.05) | |||
| 9 | When experts disagree on a science question, it’s because they don’t now all the facts yet. | epistemic assumptions | – | -0.12 | |||
| 10 | I get personal satisfaction when I solve a scientific problem by figuring it out myself. | sense of agency | + | 0.18 | 🗷 (-0.28; 0.009) | 🗷 (-0.39; 0.004) | |
| 11 | Since nothing in science is known for certain, all theories are equally valid. | epistemic assumptions | – | -0.16 | |||
| 12 | Science is essentially an accumulation of facts, rules, and formulas. | epistemic assumptions | – | -0.20 | |||
| 13 | I can do well in science courses. | sense of agency | + | 0.24 | 🗷 (-0.39; <0.001) | 🗷 (-0.33; 0.008) | |
| 14 | Real scientists don’t follow the scientific method in a straight line. | + | -0.09 | ||||
| 15 | There is too much emphasis in science classes on figuring things out for yourself. | sense of agency | – | -0.34 | |||
| 16 | Only scientific experts are qualified to make judgements on scientific issues. | epistemic assumtpions & sense of agency | – | -0.26 | |||
| 17 | Scientists know what the results of their experiments will be before they start. | epistemic assumptions | – | -0.17 | |||
| 18 | Explaining science ideas to others has helped me understand the ideas better | + | 0.11 | ||||
| 19 | The main job of the instructor is to structure the work so that we can learn it ourselves. | sense of agency | + | 0.16 | |||
| 20 | Scientists play with statistics to support their own ideas. | epistemic assumptions | – | -0.26 | |||
| 21 | Lab experiments are used to confirm information studied in science class. | – | 0.01 | 🗹 (-0.38; 0.005) | |||
| 22 | If an experiment shows that something doesn’t work, the experiment was a failure. | – | -0.19 |
Data analysis
As survey question responses did not have numerical values, we coded the data before analysis. We coded the following responses as binary: gender (female vs. male, because no other answers were given), ethnicity (white vs. all others, because diversity was so low), major (biology vs. all others, because biology majors may be most invested in the course), previous research experience (none vs. any), and plans after undergraduate degree (graduate school vs. other plans, because those planning on graduate school may be more engaged in academics). Status in school was converted to an ordinal 1-5 scale (first year, second-year, third-year, fourth or more-year, graduate student). Answers to the question “When someone discusses a “career scientist”, how easy is it for you to visualize a career of that sort?” were also converted to a 1-5 scale (no clue, vague idea, not confident, good idea, very clear idea). We converted students’ perceived relative level of scientific skill to a 1-5 scale and summed responses to six questions, as a measure of self-confidence (minimum score 6, maximum score 30). The attitude about science questions were converted to a 1-5 scale as well.
We first determined the extent to which the 22 science attitude responses were correlated with each other within our dataset. We conducted a principal component analysis (PCA) using the ‘prcomp’ function in R (version 3.3.2). We centered (mean = 0) but did not scale the responses, instead opting to retain differences in variability among them. To answer our first question regarding how our students’ attitudes about science compared to average attitudes nationwide, we calculated means, standard deviations, and standard errors for each of the 22 science attitude items for each of our four surveys, to compare to each other and Lopatto’s nationwide data (unpublished data, N=18,062).
To answer our second question, how are attitudes affected by each CURE within this one-semester course?, we performed linear regressions using the ‘lm’ function in R (version 3.3.2). Our covariates were: post CURE survey number (coded as a binary indicator variable for each survey), gender, ethnicity, status in school, major, previous research experience, graduate school plans, confidence in what a career scientist is, and confidence in scientific skills. We ran a linear regression with the response variable as principal component 1 (PC 1) from above, as well as for each of the 22 science attitude items.
Results
We discarded surveys that were not complete (specifically, those in which the student did not respond to the last science attitude item). Between 30 and 203 students completed each survey, with the highest response rate for the first survey (23% of students responded to the pre survey, 10.5% responded to the post CURE 1 survey, 6.1% responded to the post CURE 2 survey, 3.4% responded to the post CURE 3 survey; Table 3). The average student spent about five minutes on the survey (s.d. = 179). Our respondents were female-biased (relative to a 50:50 sex ratio), much like found in the nationwide data. Dissimilar to the nationwide data, our student population was less diverse ethnically and dominated by first-year students, and fewer (a little over half) were planning on attending graduate school. About 20% of respondents were biology majors, and roughly half of respondents had some kind of research experience prior to this course (Table 3). Compared to the nationwide dataset, our students were not as confident in visualizing a career scientist (roughly a third could vs. half of students nationwide), but we saw improvement in this aspect across our surveys. Last, average students’ perceptions of their scientific skills levels were steady across the four surveys, with an average score of approximately 22 out of 30 (Table 3).
| Pre | Post 1 | Post 2 | Post 3 | Nationwide Pre-Course Survey | Nationwide Post-Course Survey | |
|---|---|---|---|---|---|---|
| Started survey (N) | 219 | 104 | 55 | 34 | 18,062 | 18,062 |
| Completed survey (n) | 203 | 93 | 53 | 30 | Depends on question | Depends on question |
| Median time spent on survey (in seconds) | 303 | 290 | 292 | 274.5 | NA | NA |
| Proportion female | 0.63 | 0.67 | 0.70 | 0.67 | 0.646 (n=17,810) | 0.646 (n=810) |
| Proportion non-white ethnicity | 0.10 | 0.07 | 0.02 | 0 | 0.595 (n=17,638) | 0.595 (n=17,638) |
| Proportion first-year undergraduate | 0.67 | 0.61 | 0.55 | 0.70 | 0.341 (n=17,889) | 0.341 (n=17,889) |
| Proportion majoring in Biology dept. | 0.24 | 0.22 | 0.19 | 0.23 | NA | NA |
| Proportion participatd in any research before this course | 0.38 | 0.51 | 0.64 | 0.63 | NA | NA |
| Proportion planning on graduate school | 0.61 | 0.59 | 0.55 | 0.73 | 0.94 (n=17,014) | 0.858 (n=15,854) |
| Proportion who can visualize a career scientist | 0.21 | 0.33 | 0.45 | 0.37 | 0.52 (n=3,296) | NA |
| Average confidence in scientific process (max = 30) | 21 | 22 | 22 | 23 | NA | NA |
We conducted a principal component analysis (PCA) with all 22 science attitude items with all surveys pooled (the data do not segregate by survey type; Supplemental Figure 1). The first principal component (PC 1) explained 18.4% of the variance in the data, and PC 2 explained an additional 8.84% of the data. Thereafter, there was a steady decline in the proportion of variance explained (PC 3 explains 7.14%, PC 4 explains 6.74%, PC 5 explains 6.26%, etc.). The PC 1 loadings (Table 2) were positively correlated with the responses expected from scientifically mature students (i.e., those with more complex thinking), as described in Wenk (2000) (r = 0.82 (95% CI: 0.61-0.92), R2 = 0.68). We will refer to PC 1 as a measure of scientific maturity hereafter.
We compared our students’ mean responses to the attitudes about science statements: 1) to the mean scores of the nationwide data, 2) to the expected response for a scientifically mature student, and 3) across the four surveys we administered (for plotting purposes, all negative responses were reversed to positive in Figure 2; Supplemental Table 1). We will focus on the first two comparisons in this paragraph. The 95% CIs for our students’ mean responses overlapped the nationwide pre-course or post-course means or both in most cases but were different from the national averages in six cases. Our students exceeded the national average on four items: 1) creativity does not play a role in science (item 7), 2) since nothing in science is known for certain, all theories are equally valid (item 11), 3) only scientific experts are qualified to make judgements on scientific issues (item 16), and 4) if an experiment shows that something doesn’t work, the experiment was a failure (item 22). Our students fell below the national average on two items: 1) you can rely on scientific results to be true and correct (item 2), and 2) when experts disagree on a science question, it’s because they don’t know all the facts yet (item 9). Most mean responses, ours and nationwide, to the attitude statements were in the expected direction (i.e., expected for scientifically mature students, near a mean score of 3, at least, or above, in Figure 2). However, there were three items that USU and nationwide students responded to unexpectedly (below 3, in Figure 2): 1) you can rely on scientific results to be true and correct (item 2), 2) science is essentially an accumulation of facts, rules, and formulas (item 12), and 3) lab experiments are used to confirm information studied in science class (item 21).
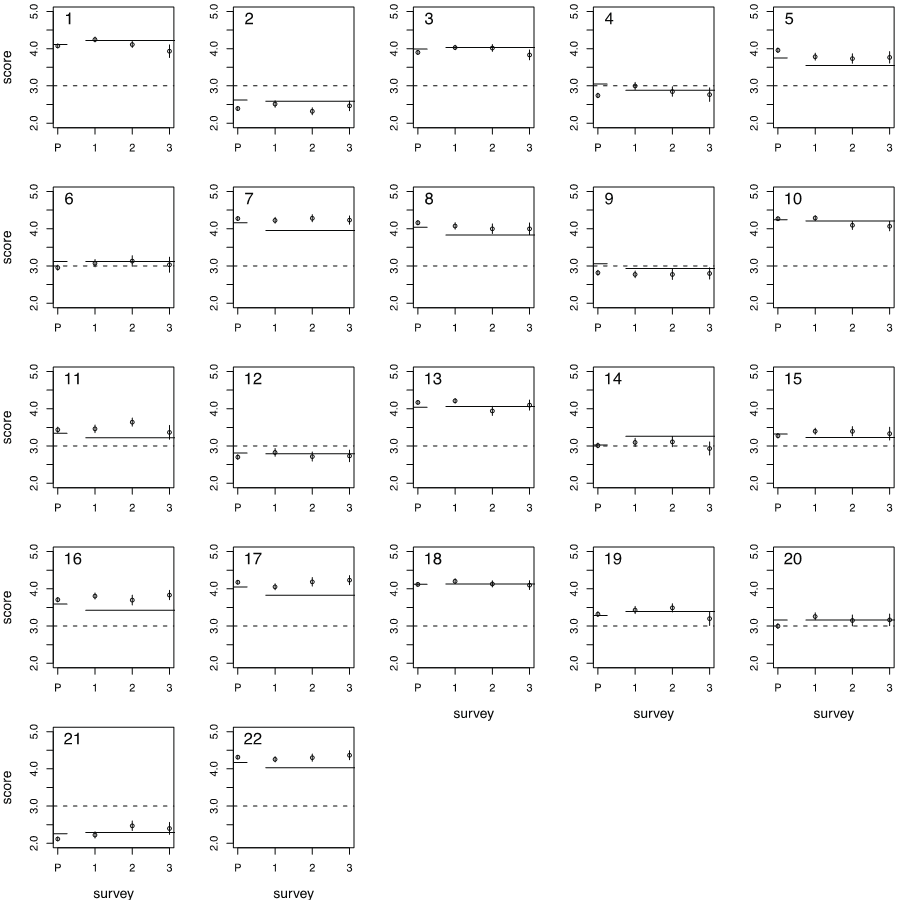
Changes in mean responses to the attitudes about science statements across the four surveys were slight (see four circles in each plot of Figure 2), which is similar to the differences seen in the nationwide pre- and post-course means (horizontal solid lines in each plot of Figure 2). In some cases, the nationwide means increase from pre- to post-course survey, that is, students’ attitudes towards science improve (e.g., a 0.11 difference in means in plot 1 of Figure 2), but more often they stay the same or decrease (Figure 2; Supplemental Table 1). One might expect to see a steady increase in means across our surveys if students’ attitudes about science improved after each authentic science experience, but the slight changes in means across our four surveys were not linear. Thus, in our linear regressions, we treat each CURE in the course as an independent experience (i.e., a categorical factor), not contingent on the previous CURE.
When we performed a linear regression with PC 1 as the response variable, we learned that student’s confidence in what a career scientist is (β: 0.38, p-value < 0.001) and their confidence in the process of science skills (β: 0.13, p-value < 0.001) were the biggest predictors of their scientific maturity, not the CUREs or the other covariates (R2 = 0.16). Whereas looking at PC 1 is a reasonable way to distill the science attitude items into one variable, we also ran a linear regression for each of 22 science attitude items and focused on the items that significantly changed as a factor of the CUREs (Supplemental Table 3 has βs and p-values for all covariates and response variables and R2 for each model). One item, “when scientific results conflict with my personal experience, I follow my experience in making choices,” changed significantly in the expected (negative) direction after students completed CURE 1 (a 0.26 difference in means from the pre survey, Supplemental Table 1; R2 = 0.05, Supplemental Table 2). After CURE 2, the response to five items changed significantly (Table 2), but only one in the expected (negative) direction: “lab experiments are used to confirm information studied in science class” (a 0.39 difference in means from the pre survey, Supplemental Table 1; R2 = 0.05, Supplemental Table 2). Lastly, three items changed after CURE 3, all of which were in the unintended direction (Table 2; Supplemental Table 2). Two items changed in the unintended direction in both CURE 2 and CURE 3: “I get personal satisfaction when I solve a scientific problem by figuring it out myself” and “I can do well in science courses.”
Across the semester, roughly three quarters of survey respondents said they were likely or very likely to choose another research experience (88% of students after CURE 1, 79% of students after CURE 2, and 73% of students after CURE 3). A number of students made open-ended comments about each CURE (n = 27, 24, and 10, respectively). For each survey, more positive comments were made than neutral or negative comments (Supplemental Table 3). Some students appreciated that so many students were able to do real field work right outside of the classroom building during CURE 1, while one student was disappointed that they mainly experienced data collection and not the other steps of the scientific process. Some students found CURE 2 gave them needed practice with writing about all steps of the process of science and a better appreciation of what it takes to publish research, while others wished the activities in the lab directly supported what they learned in the introductory biology lecture course. Some students liked working with an animal system in CURE 3 (CURE 1 and 2 were plant and fungus projects, respectively), while others did not end up seeing the connection between the methods performed and the graduate student’s hypothesis.
Discussion
We had more post-CURE respondents that felt comfortable visualizing a career scientist than pre-CURE respondents. The CUREs varied in theme, freedom, and length. About three-fourths of respondents to all three post CURE surveys would likely or very likely choose to seek out another opportunity to do authentic science. Each CURE elicited more positive comments than neutral or negative. Some comments eluded to an appreciation of the variety of CUREs offered in the course. Our results were also sobering. First, student self-confidence, in accurately visualizing a career scientist and in their performance on parts of the process of science, was the greatest predictor of scientific maturity, not the CUREs in BIOL 1615. Second, overall, little change in science attitude was seen after each CURE. But when looking at each of the science attitudes items separately, we do seem to have a positive influence over specific aspects of students’ science attitudes, whether the CURE is short or long. Specifically, we can help students make decisions based on scientific results, even when they conflict with personal preconceptions, and see that science is more than learning content in a large lecture-style classroom. We also have the ability to negatively affect students’ science attitudes, especially when it comes to their satisfaction with solving problems on their own and their ability to succeed in science courses in general.
Comparison to similar research
Other researchers have seen little change in science attitude across a course, too. Wenk (2000) compared attitudes between students who experienced scientific inquiry vs. students who worked on content mastery during a semester. The overall direction of change on the epistemic assumptions about science knowledge items was in the negative (unexpected) direction. But when looking into the details, Wenk found that students in the content mastery group shifted to greater comfort with uncertainty in science but reported less curiosity about science and a greater belief that science courses are important only to science majors. Students in the inquiry group were perhaps more apt to be persuaded by scientific results. Hunter et al. (2007) found epistemological beliefs tend to remain stable in science undergraduate research experience (URE; similar to a CURE but typically a longer research experience) participants interviewed repeatedly over several years. These findings, with ours, suggest that the epistemological beliefs of undergraduate science students do not shift rapidly, however, some programs have documented significant change in student insight into the process of science and their beliefs about learning in a single semester (e.g., the C.R.E.A.T.E. program that uses intensive analysis of primary literature to demystify science; Hoskins, et al., 2011). Perera et al. (2017) summarizes other studies and concludes that changing students’ attitudes toward science, in the short or long term, is not straightforward.
Other researchers have distilled the 22 science attitude survey items into one or two variables, and their results are similar but not exact to ours. We view PC 1 as an overall measure of scientific maturity (as in Wenk, 2000). Perera et al. (2017) used factor analysis for variable distillation and found one factor that assessed whether students value learning science, which corresponded to some of our high positive PC 1 loadings. Another factor they found indicated whether the students likely had a more advanced understanding of how science works and what it means to do science, and these items all had low negative PC 1 loadings in our study. Lopatto (unpublished data) found five of the science attitude items positively correlated with student-reported learning gains (items 1, 3, 10, 13 and 18, all of which had high positive PC 1 loadings in our study).
We retained the original wording of the items from Wenk (2000) for comparison purposes, but Perera et al. (2017) reworded nine of the items as informed by results of an expert review at their university. They revised the items to clarify them without changing their initial meanings, including the three items students, across the board, struggled with the most (items 2, 12, and 21). For example, instead of “you can rely on scientific results to be true and correct,” they said, “the purpose of science is to identify true facts.” It is unclear how the revised wording might have affected our students, however, Perera et al. (2017) found that factor analyses with and without the reworded items changed the exact factor loadings but not the groupings themselves. The struggle with these three particular statements might be more associated with students having more experience with learning scientific facts than engaging in science (Wenk, 2000). We promote teaching science via inquiry to give students the opportunity to learn that science is a complex endeavor that always involves uncertainty, an uncertainty that does not undermine science’s usefulness in making decisions.
Future directions
We plan to use our results to inform how we train the graduate teaching assistants (GTAs) that mentor and guide the students in this course. The GTAs are asked to point out to students that things do not always work as anticipated, a reality of “real” science. We consciously design our CUREs in a way that balances reaching successful results with providing real, unpredictable science; for example, if students do not successfully culture endophytes in CURE 2, we have back-up endophytes to sample from. We do not penalize students for the unexpected but evaluate their interpretation of it. But perhaps more can be done to keep students from equating setbacks in the process of science with their overall performance in science courses (Indorf et al. (2019) experienced similar student dissatisfaction). Our next step is to shift the focus of our GTA teacher training from logistics to teacher empowerment. We will emphasize the importance of the CUREs as an instructional technique and the significance of GTAs’ potential to enhance the undergraduates’ research experiences (similar to Flaherty et al., 2017b). We will survey the GTAs to better understand the challenges GTAs face leading these introductory biology CUREs (similar to Heim & Holt, 2019), to better help them overcome the challenges. Good interactions between students and instructors can have many benefits, from navigating the uncertainty inherent in science research to connecting students to networks that promote their career development (Auchincloss et al., 2014).
We hope our students are gaining at least a little more confidence in doing science during these CUREs, which could lead to more positive attitudes when faced with real science in the future. Given that most respondents to our surveys want more research experiences, we will continue to encourage other faculty members in our department and others to, at a minimum, implement epistemically demanding practices in their courses, like developing hypotheses and analyzing data, which can be done in any classroom setting. We support Auchincloss et al.’s (2014) argument for curriculums having more CUREs for students to participate in. The more CUREs students have, the more likely it will be they will reach challenging outcomes, like having the ability to navigate uncertainty, obtaining a science identity, and persisting in science.
Limitations
Above all, this assessment of the CUREs in our course was valuable in directing us to the aspects of student attitudes of which we have influence, and in confirming the amount of time and effort it takes to improve student attitudes about science. We note that survey response rates were lower than the number of students enrolled in the course, 884, and response rate nearly halved across the surveys, most likely due to the increase in time constraints undergraduates experience across a semester. Yet, our lowest sample size, 30 post CURE 3 respondents, was on par with sample sizes seen in similar studies (e.g., 16 participants in Harrison et al., 2011). We acknowledge selection bias in our study. Selection biases are common in survey research, but they raise concerns that the retained students do not represent the overall population. In particular, ethnic diversity was absent in the last set of survey respondents, and more of these students were first-year students and were planning to attend graduate school than the respondents of the other three surveys.
We made all of our surveys anonymous to protect our students’ identity and mitigate the threat of social bias, in which students respond a certain way because they are either implicitly or explicitly aware of the desired response (Bowman & Hill, 2011). We were not able to identify the influence the lab instructor or section had on attitudes. We decided not to assign pseudonyms to 884 students, in which case answers could have been matched to a student across surveys. By doing so, we may have mitigated the issue of testing fatigue and increased our sample size of unbiased students. We expect that if we tracked students across surveys and only used data from students who took all four surveys, samples sizes would have been considerably lower, and responses may have been biased towards the most diligent students. Instead, we relied on group means from unknown individuals, meaning that completed surveys at each point could have been from entirely different students. Here, we have a sample of our student population at each time point, and we account for this in our linear regression models.
We did not have a control group in which some BIOL 1615 lab sections did not experience the CUREs. Addressing the effect of CUREs vs. no CUREs on students has been addressed by others (e.g., Wenk, 2000; Indorf et al., 2019). Here we were interested in the differences in student science attitudes across our CUREs. We encourage researchers to use the CURE Survey science attitude items in other settings.
References
Astin, A. W. (2003). Studying how college affects students: a personal history of the CIRP: the CIRP’s founder surveys the past, present, and future of the thirty-seven-year-old program. About Campus, 8(3), 21-28.
Auchincloss, L. C., Laursen, S. L., Branchaw, J. L., Eagan, K., Graham, M., Hanauer, D. I., Lawrie, G., McLinn, C. M., Palaez, N., Rowland, S., Towns, M., Trautmann, N. M., Varma-Nelson, P., Weston, T. J., & Dolan, E. L. (2014). Assessment of course-based undergraduate research experiences: a meeting report. CBE – Life Sciences Education, 13, 29-40.
Bascom-Slack, C. A., Arnold, A. E., & Strobel, S. A. (2012). Student-directed discovery of the plant microbiome and its products. Science, 338, 485-486.
Bowman, N.A. & Hill, P. L. (2011). Measuring how college affects students: social desirability and other potential biases in college student self reported gains. New Directions for Institutional Research, 150, 73-85.
Chen, S. (2006). Development of an instrument to assess views on nature of science and attitudes toward teaching science. Science Education, 90(5), 803-819.
Denofrio, L. A., Russell, B., Lopatto, D., & Lu, Y. (2007). Linking student interests to science curricula. Science, 318, 1872-1873.
Flaherty, E. A., Walker, S. M., Forrester, J. H., & Ben‐David, M. (2017a). Effects of course‐based undergraduate research experiences (CURE) on wildlife students. Wildlife Society Bulletin, 41(4), 701-711.
Flaherty, A., O’Dwyer, A., Mannix-McNamara, P., & Leahy, J. J. (2017b). The influence of psychological empowerment on the enhancement of chemistry laboratory demonstrators’ perceived teaching self-image and behaviours as graduate teaching assistants. Chemistry Education Research and Practice, 18(4), 710-736.
Halloun, I., & Hestenes, D. (1996). Views about sciences survey: VASS. www.pearweb.org/atis/tools/14
Hanauer, D. I., Frederick, J., Fotinakes, B., Strobel, S. A. (2012). Linguistic analysis of project ownership for undergraduate research experiences. CBE – Life Sciences Education, 11, 378–385.
Hanauer, D. I., Graham, M. J., Betancur, L., Bobrownicki, A., Cresawn, S. G., Garlena, R. A., Jacobs-Sera, D., Kaufmann, N., Pope, W. H., Russell, D. A., Jacobs, W. R. Jr., Sivanathan, V., Asai, D. J. & Hatfull, G. F. (2017). An inclusive Research Education Community (iREC): Impact of the SEA-PHAGES program on research outcomes and student learning. Proceedings of the National Academy of Sciences, 114(51), 13531-13536.
Harrison, M., Dunbar, D., Ratmansky, L., Boyd, K., & Lopatto, D. (2011). Classroom-based science research at the introductory level: changes in career choices and attitude. CBE – Life Sciences Education, 10(3), 279-286.
Heim, A. B., & Holt, E. A. (2019). Benefits and challenges of instructing introductory biology course-based undergraduate research experiences (CUREs) as perceived by graduate teaching assistants. CBE – Life Sciences Education, 18(3), ar43.
Hoskins, S. G., Lopatto, D., & Stevens, L. M. (2011). The CREATE approach to primary literature shifts undergraduates’ self-assessed ability to read and analyze journal articles, attitudes about science, and epistemological beliefs. CBE—Life Sciences Education, 10(4), 368-378.
Hunter, A., Laursen, S., Seymour, E. (2007). Becoming a scientist: the role of undergraduate research in students’ cognitive, personal, and professional development. Science Education, 91, 36–74.
Indorf, J. L., Weremijewicz, J., Janos, D. P., & Gaines, M. S. (2019). Adding authenticity to inquiry in a first-year, research-based, biology laboratory course. CBE—Life Sciences Education, 18(3), ar38.
Kardash, C. M. (2000). Evaluation of an undergraduate research experience: perceptions of undergraduate interns and their faculty mentors. Journal of Educational Psychology, 92, 191–201.
Kowalski, J. R., Hoops, G. C., & Johnson, R. J. (2016). Implementation of a collaborative series of classroom-based undergraduate research experiences spanning chemical biology, biochemistry, and neurobiology. CBE—Life Sciences Education, 15(4), ar55.
Lave, J., Wenger, E. (1991). Situated learning: legitimate peripheral participation, New York: Cambridge University Press.
Lopatto, D. (2007). Undergraduate research experiences support science career decisions and active learning. CBE—Life Sciences Education, 6(4), 297-306.
Lopatto, D., Tobias, S. (2010). Science in solution: the impact of undergraduate research on student learning, Washington, DC: Council on Undergraduate Research.
Perera, V., Mead, C., Buxner, S., Lopatto, D., Horodyskyj, L., Semken, S., & Anbar, A. D. (2017). Students in fully online programs report more positive attitudes toward science than students in traditional, in-person programs. CBE—Life Sciences Education, 16(4), ar60.
Russell, C.B. & Weaver, G. C. (2011). A comparative study of traditional, inquiry-based, and research-based laboratory curricula: impacts on understanding of the nature of science. Chemistry Education Research and Practice, 12, 57–67.
Wenk, L. (2000). Improving science learning: inquiry-based and traditional first-year college science curricula. University of Massachusetts, Amherst.