15 Elements of an Issue-Analysis Report
Unsurprisingly at this point, the issue-analysis report has a set of characteristics that are associated with this particular genre. As you prepare your draft, make sure you check this list to ensure that you’re including all of the critical parts that readers[1] expect to see:
- A tightly focused topic
- Accurate, well-researched information
- A synthesis of ideas
- A variety of writing strategies
- Clear definitions
- An appropriate design
A tightly focused topic
It might be tempting to think about providing your reader with the entirety of knowledge about the issue you’ve selected. However, that is not your goal here. It’s not even a very interesting read. That’s basically what Wikipedia tries to do, and I don’t know many people who lovingly think about binge-reading a bunch of Wikipedia articles, know what I mean? Instead of trying to report on everything about an issue, try to pick a more focused topic that will allow you to learn a lot about it and present it well. For example, instead of selecting the topic of climate change, you might narrow that down a little and choose to report only on the effects of individual choices on climate change or government policies affecting the climate.
Accurate, well-researched information
You may feel like you already know everything that there is to know about your issue—at least all the important stuff, right? I mean, you’ve read all the headlines about abortion,[2] and you definitely follow all the abortion discussions on TikTok, so you’ve heard everything that people have to say. Do you really need to do any research?
Yes. Of course you do. Headlines do not communicate details, and even a lot of in-depth articles don’t cover everything, or they don’t touch on exactly what you need to know. Anyone can post anything they want on social media with very little in the way of fact checking, so how can you trust that what you’re getting is correct? And even if what you’re seeing is correct, how do you know that you’re getting the latest discoveries, discussions, and debate from the experts? I mean, these people—the experts—are the ones who have dedicated their lives and careers to the study and understanding of this issue. They are the ones you really need to hear from if you want to truly understand the issue you’ve selected to analyze and report on.
 For this paper, you’ll need to do research to find trustworthy sources to get information from. You must use at least four sources for this assignment. You can, of course, include some social media in the mix, but if you’re going to do that, I’d recommend using four quality sources and then add in others[3] to help round out the voices you include in your writing. You’re welcome, and even encouraged, to use more than four sources if you want, but you do have to meet that minimum number to get full credit.
We’ll be talking a lot about how to find and evaluate sources and use them in your writing, so don’t worry if that feels overwhelming right now.
A synthesis of ideas
Because I’m a linguistics nerd, I’ll point out that synthesis comes from a Greek root that means “to place together.” Simply put, a synthesis is a combination of ideas. However, to really achieve a synthesis of ideas, it’s not enough to just put them all together in the paper. They have to be combined to create something new and better than the simpler pieces you assembled your paper from. If you write your paper and talk about the first article you read in paragraph one, and the second paragraph covers the next article, and then the next paragraph deals with your third source, and the last body paragraph handles the fourth, you haven’t achieved a synthesis. That’s just a list of ideas from each article.
To truly develop a synthesis of ideas, you need to bring together ideas, concepts, facts, data, and examples[4] from different sources and use them next to each other in the same paragraph. Mix things up. If two different articles provide some historical background for your issue, combine those two perspectives in one paragraph and help us see how they work together. Help us understand more than we would if we just read the articles separately on our own.
A variety of writing strategies
In your literacy narrative, you didn’t have to rely on too many different writing strategies to tell your story and help us understand it. You narrated, you reflected, and you probably described. When you profiled your subject, you didn’t do too much more, I imagine. You probably narrated some bits and described them and their work.
In your report, you’ll need to flex some new compositional muscles and incorporate a wider range of writing strategies. In addition to narrating[5] and describing, you might need to compare and contrast two views, or classify things into groups, or explain a process, or explore cause and effect, or do something else I haven’t included here. The point is that you should use whatever strategy is necessary to help your reader understand the complexity of the issue and the information you discovered about it.
Clear definitions
 In this paper much more than in the last two, you will probably need to help your reader understand something tricky. Any complex issue will have technical jargon[6] that is used in very specific ways in relation to that issue and only that issue. These will come up a lot as you dig into academic sources, written by experts and intended for experts to read. You might struggle with understanding the sources yourself.[7] As such, you will likely need to provide a definition or two for your reader to help them follow your report and comprehend your writing. Make sure you take the time to provide clear, understandable definitions whenever you incorporate tricky vocabulary into your writing.
An appropriate design
Sometimes, paragraph-style writing is not the best way to communicate information to your readers. Writing out in full sentences all of the statistical findings of some research study would be really difficult to understand and horribly boring to read. Make sure you consider whether a table or graph might make that information easier to take in for your readers. You might also consider using a list instead of full sentences in some places. Photos, audio, or videos could also be embedded if that is the best way to present information to the reader in a way they can understand.
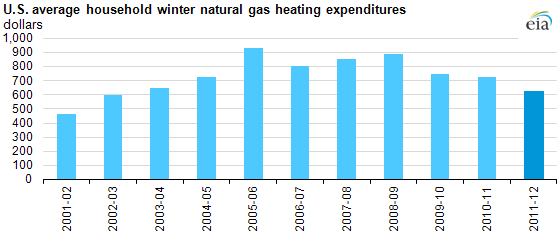
Consider the following paragraph explaining data related to how much money the average U.S. household spends on natural gas to heat their homes each winter:
Bad Example
Over the previous ten years, the amount of money that the average U.S. household has spent on gas has varied dramatically. In the winter of 2001-02, the average household spent $466 on natural gas to heat their homes, while the following winter, that same household spent $600. During the winter of 2003-04, the average household increased their spending slightly to $650, followed by a larger increase to $720 the winter after that. The winter of 2005-06 saw the highest amount spent by the average U.S. household, costing them around $920. The following winter saw a sizable drop in spending, back down to $800, but spending went back up again the winter of 2007-08, jumping up to $850. During the winter of 2008-09, we saw spending increase yet again up to $890 before the largest decrease on record, down to $740. The following two winters also saw drops, down to $720 in 2010-11 and even further to $620 in 2011-12.
Phew. That was miserable to type, and I bet it’s even more miserable to read. You might feel even worse, still, when you realize that, instead of forcing your readers to digest over 160 words of sludge, you could have just presented the following graph and communicated the same information in a much easier format:
Example

See? That was way easier to understand, even if you just glanced at it. You can spot trends and big jumps or drops in spending without having to drag yourself through all that boring text. Wahoo!
When you are writing your report, you must make decisions about what will help make your data easier for your readers to understand. There are lots of ways to present data, so feel free to ask if any particular strategy would be better or worse than simply writing it all out in sentences.
- Including your professor. ↵
- The articles are just soooo long! ↵
- High quality or social media or whatever else. ↵
- Or whatever else you want to use. ↵
- Which you probably won’t do much. ↵
- Words that have a specific meaning within a certain field. For example, in photography, terms such as iris, meter, lens and diaphragm have meanings that are different from those words in other contexts. ↵
- And that’s okay! ↵

