Thematic Analysis
As its name suggests, with thematic analysis we are attempting to identify themes or common ideas across our data. Themes can help us to:
- Determine shared meaning or significance of an event
- Povide a more complete understanding of concept or idea by exposing different dimensions of the topic
- Explore a range of values, beliefs or perceptions on a given topic
Themes help us to identify common ways that people are making sense of their world. Let’s say that you are studying empowerment of older adults in assisted living facilities by interviewing residents in a number of these facilities. As you review your transcripts, you note that a number of participants are talking about the importance of maintaining connection to previous aspects of their life (e.g. their mosque, their Veterans of Foreign Wars (VFW) Post, their Queer book club) and having input into how the facility is run (e.g. representative on the board, community town hall meetings). You might note that these are two emerging themes in your data. After you have deconstructed your data, you will likely end up with a handful (likely three or four) central ideas or take-aways that become the themes or major findings of your research.
Variations in approaches to thematic analysis
There are a variety of ways to approach qualitative data analysis, but even within the broad approach of thematic analysis, there is variation. Some thematic analysis takes on an inductive analysis approach. In this case, we would first deconstruct our data into small segments representing distinct ideas (this is explained further in the section below on coding data). We then go on to see which of these pieces seem to group together around common ideas.
In direct contrast, you might take a deductive analysis approach (like we discussed in Chapter 6), in which you start with some idea about what grouping might look like and we see how well our data fits into those pre-identified groupings. These initial deductive groupings (we call these a priori categories) often come from an existing theory related to the topic we are studying. You may also elect to use a combination of deductive and inductive strategies, especially if you find that much of your data is not fitting into deductive categories and you decide to let new categories inductively emerge.
A couple things to note here. If you are using a deductive approach, be clear in specifying where your a priori categories came from. For instance, perhaps you are interested in studying the conceptualization of social work in other cultures. You begin your analysis with prior research conducted by Tracie Mafile’o (2004) that identified the concepts of fekau’aki (connecting) and fakatokilalo (humility) as being central to Tongan social work practice.[8] You decide to use these two concepts as part of your initial deductive framework, because you are interested in studying a population that shares much in common with the Tongan people. When using an inductive approach, you need to plan to use memoing and reflexive journaling to document where the new categories or themes are coming from.
Identifying, reviewing, and refining themes
Now we have our codes, we need to find a sensible way of putting them together. Remember, we want to narrow this vast field of hundreds of codes down to a small handful of themes. If we don’t review and refine all these codes, the story we are trying to tell with our data becomes distracting and diffuse. An example is provided below to demonstrate this process.
As we refine our thematic analysis, our first step will be to identify groups of codes that hang together or seem to be related. Let’s say you are studying the experience of people who are in a vocational preparation program and you have codes labeled “worrying about paying the bills” and “loss of benefits”. You might group these codes into a category you label “income & expenses” (Figrue 19.6).
| Code | Category | Reasoning |
| Worrying about paying the bills | Income & expenses | Seem to be talking about financial stressors and potential impact on resources |
| Loss of benefits |
| Code | Category | Reasoning | Category | Reasoning |
| Worrying about Paying the bills | Income & expenses | Seem to be talking about financial stressors and potential impact on resources | Financial insecurities | Expanded category to also encompass personal factor- confidence related to issue |
| Loss of benefits | ||||
| Not confident managing money |
You may review and refine the groups of your codes many times during the course of your analysis, including shifting codes around from one grouping to another as you get a clearer picture of what each of the groups represent. This reflects the iterative process we were describing earlier. While you are shifting codes and relabeling categories, track this! A research journal is a good place to do this. So, as in the example above, you would have a journal entry that explains that you changed the label on the category from “income & expenses” to “financial insecurities” and you would briefly explain why. Your research journal can take many different forms. It can be hard copy, an evolving word document, or a spreadsheet with multiple tabs (Figure 19.8).
| Journal Entry Date: 10/04/19 Changed category [Income & expenses] to [Financial insecurities] to include new code “Not confident managing money” that appears to reflect a personal factor related to the participant’s confidence or personal capability related to the topic. |
Now, eventually you may decide that some of these categories can also be grouped together, but still stand alone as separate ideas. Continuing with our example above, you have another category labeled “financial potential” that contains codes like “money to do things” and “saving for my future”. You determine that “financial insecurities” and “financial potential” are related, but distinctly different aspects of a broader grouping, which you go on to label “financial considerations”. This broader grouping reflects both the more worrisome or stressful aspects of people’s experiences that you have interviewed, but also the optimism and hope that was reflected related to finances and future work (Figure 19.9).
| Code | Category | Reasoning | Category | Reasoning | Theme |
| Worrying about paying the bills | Income & expenses | Seem to be talking about financial stressors and potential impact on resources | Financial insecurities | Expanded category to also encompass personal factor- confidence related to issue | Financial considerations |
| Loss of benefits | |||||
| Not confident managing money | |||||
| Money to do things | Financial potential | Reflects positive aspects related to earnings | |||
| Saving for my future |
This broadest grouping then becomes your theme and utilizing the categories and the codes contained therein, you create a description of what each of your themes means based on the data you have collected, and again, can record this in your research journal entry (Figure 19.10).
| Journal Entry Date: 10/10/19 Identified an emerging theme [Financial considerations] that reflects both the concerns reflected under [Financial insecurities] but also the hopes or more positive sentiments related to finances and work [Financial potential] expressed by participants. As participants prepare to return to work, they appear to experience complex and maybe even conflicting feelings towards how it will impact their finances and what this will mean for their lives. |
Building a thematic representation
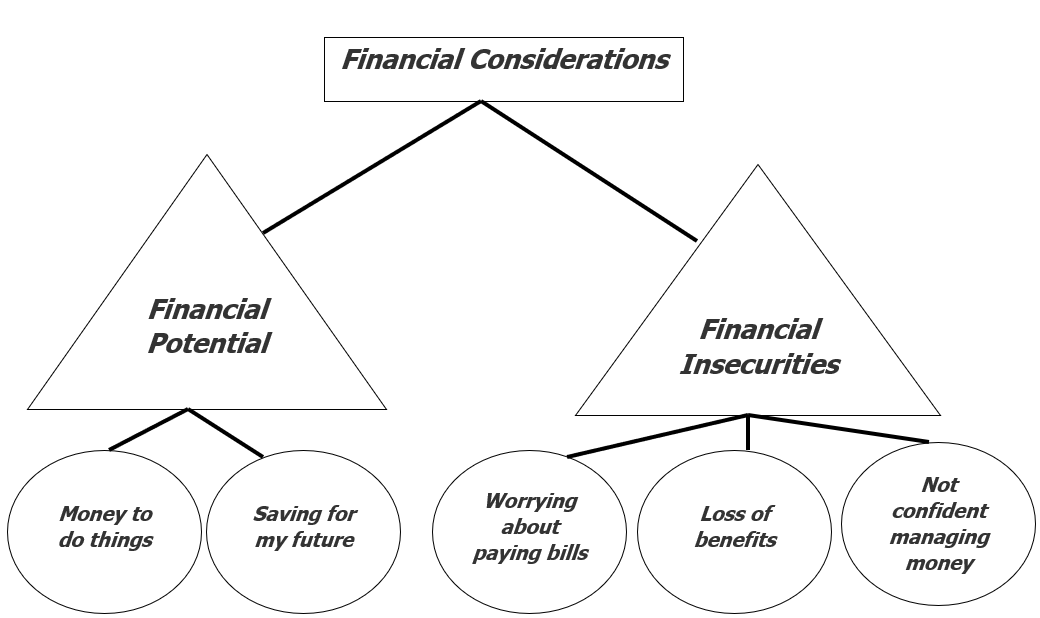
However, providing a list of themes may not really tell the whole story of your study. It may fail to explain to your audience how these individual themes relate to each other. A thematic map or thematic array can do just that: provides a visual representation of how each individual category fits with the others. As you build your thematic representation, be thoughtful of how you position each of your themes, as this spatially tells part of the story.[14] You should also make sure that the relationships between the themes represented in your thematic map or array are narratively explained in your text as well.
Figure 19.11 offers an illustration of the beginning of thematic map for the theme we had been developing in the examples above. I emphasize that this is the beginning because we would likely have a few other themes (not just “financial considerations”). These other themes might have codes or categories in common with this theme, and these connections would be visual evident in our map. As you can see in the example, the thematic map allows the reader, reviewer, or researcher can quickly see how these ideas relate to each other. Each of these themes would be explained in greater detail in our write up of the results. Additionally, sample quotes from the data that reflected those themes are often included.
Taken from:
Graduate research methods in social work
CC BY-NC-SA | 16 H5P activities | 250,919 words
Author(s): Matthew DeCarlo, Cory Cummings, Kate Agnelli
Editor(s): Dalia Khoury
Subject(s): Social work, Research methods: general
Last updated: 10-6-2020
Publisher: Open Social Work
Language: English
Determining when you are finished
When conducting quantitative research, it is perhaps easier to decide when we are finished with our analysis. We determine the tests we need to run, we perform them, we interpret them, and for the most part, we call it a day. It’s a bit more nebulous for qualitative research. There is no hard and fast rule for when we have completed our qualitative analysis. Rather, our decision to end the analysis should be guided by reflection and consideration of a number of important questions. These questions are presented below to help ensure that your analysis results in a finished product that is comprehensive, systematic, and coherent.
Have I answered my research question?
Your analysis should be clearly connected to and in service of answering your research question. Your examination of the data should help you arrive at findings that sufficiently address the question that you set out to answer. You might find that it is surprisingly easy to get distracted while reviewing all your data. Make sure as you conducted the analysis you keep coming back to your research question.
Have I utilized all my data?
Unless you have intentionally made the decision that certain portions of your data are not relevant for your study, make sure that you don’t have sources or segments of data that aren’t incorporated into your analysis. Just because some data doesn’t “fit” the general trends you are uncovering, find a way to acknowledge this in your findings as well so that these voices don’t get lost in your data.
Have I fulfilled my obligation to my participants?
As a qualitative researcher, you are a craftsperson. You are taking raw materials (e.g. people’s words, observations, photos) and bringing them together to form a new creation, your findings. These findings need to both honor the original integrity of the data that is shared with you, but also help tell a broader story that answers your research question(s).
Have I fulfilled my obligation to my audience?
Not only do your findings need to help answer your research question, but they need to do so in a way that is consumable for your audience. From an analysis standpoint, this means that we need to make sufficient efforts to condense our data. For example, if you are conducting a thematic analysis, you don’t want to wind up with 20 themes. Having this many themes suggests that you aren’t finished looking at how these ideas relate to each other and might be combined into broader themes. Having these sufficiently reduced to a handful of themes will help tell a more complete story, one that is also much more approachable and meaningful for your reader.
