Multiple Methods and Mixed Methods Designs
Up to this point, we have discussed research design as though it is an either/or proposition. Either you will collect qualitative data or you will collect quantitative data. Either your approach will be idiographic or it will be nomothetic. In truth, you don’t necessarily have to choose one approach over another. In fact, some of the most highly regarded social scientific investigations combine approaches in an effort to gain the most complete understanding of their topic possible. Using a combination of multiple and different research strategies is called triangulation – you might remember this word from talking about qualitative research designs. Triangulation is a way of strengthening the validity of a study by employing multiple forms of data, multiple investigators, multiple theoretical perspectives, or multiple research methods. Most subjects can benefit from additional methods, but with added methods comes added complexity and more issues of validity to consider, so think carefully about how much you need to include in one study before you decide you want to bring everything together at once! Let’s explore though; what could it look like to use multiple methods in one study?
Consider the various ways you could study electronic gadget addiction. Surveys could work – maybe of college students? How about focus groups with professors to see how they use their own devices and how they see student using them in classrooms? What about some interviews with college support specialists to see how they work with students with gadget trouble? Maybe you want to examine the policies of the school to see how gadgets and electronics are regulated. Perhaps you need some unobtrusive information; in that case, observing students throughout their days on campus may tell you important information. Now imagine that you could conduct two, or even three, of those studies instead of just one. What if you could conduct a survey of students on campus, a content analysis of campus policies, and observations of students in their natural environments (Brewer & Hunter, 1989; Tashakkori & Teddlie, 1989)? Triangulation isn’t just about using multiple strategies of data collection. Triangulation of measures occurs when researchers use multiple approaches to measure a single variable. Triangulation of theories occurs when researchers rely on multiple theories to help explain a single event or phenomenon. If you’d like to learn more about triangulation, the following sources may be of interest:
Aside from being pretty exhausted, and possibly broke, you’d probably end up with a fairly comprehensive understanding of the causes and consequences of, and campus responses to, students’ electronic gadget addictions. And certainly, a more comprehensive understanding is better than a less comprehensive one. The drawback, of course, is that you may not have the resources, because of either limited time or limited funding, to conduct such a wide-ranging study.
At this stage, you may be telling yourself that it would be nearly impossible to conduct all these studies yourself. You have a life, after all. The good news is that you don’t necessarily have to do everything on your own in order to take advantage of the analytic benefits of triangulation. Perhaps someone already has conducted a large survey of the topic you wish to study. You could find out how those results compare with your one-on-one interviews with people on the same topic. Or perhaps you wish to administer a survey to test the generality of some findings that have been reached through the use of field methods. Whatever the case, don’t forget about all the good research that has come before you that can help strengthen your investigation. Also keep in mind that qualitative and quantitative research methods can be complementary. Triangulation is one way to take advantage of the best in both approaches, and you don’t have to do all the work yourself.
Perhaps, however, you are thinking about how you could do multiple things in one study; in this case, maybe you’re interested in some mixed-methods action?
What Is It? Triangulation, Multiple Methods, and Mixed Methods
First, a bit of nomenclature. Mixed methods can be understood as a path toward triangulation. Let’s say that Anikit wants to know more about how first-year college students acclimate to college. He could talk to some college students (conduct interviews) and also observe their behavior (fieldwork). He is strengthening the validity of his study by including multiple forms of data. If both the interview and the observations indicate heavy reliance on peer networks, a reported finding about the importance of peers would be more credible than had he only interviewed students or only observed them. If he discovers that students say one thing but do another (which is pretty common, after all), then this, too, becomes an interesting finding (e.g., Why do they forget to talk about their peers when peers have so much observable influence?). In this case, we say that Anikit is employing multiple forms of data, or even that he relies on multiple methods. But he is not, strictly speaking, mixing data. Mixed methods refer specifically to the use of both quantitative and qualitative research methods. If Anikit were to supplement his interviews and/or observations with a random sample of one thousand college students, he would then be employing a mixed methods approach. Although he might not get the rich details of how friends matter in the survey, the large sample size allows statistical analyses of relationships among variables, perhaps showing which groups of students are more likely to benefit from strong peer networks. So to summarize, both multiple methods and mixed methods are forms of research triangulation, but mixed methods include mixing both qualitative and quantitative research elements in the same study.
Mixed methods techniques, then, are pretty unique. Where many qualitative researchers have little interest in statistical generalizability, and many quantitative researchers undervalue the importance of rich descriptions of singular cases, the mixed methods researcher has an open mind about both approaches simultaneously. And they use the power of both approaches to build stronger results:
Quantitative (mainly deductive) methods are ideal for measuring pervasiveness of “known” phenomena and central patterns of association, including inferences of causality. Qualitative (mainly inductive) methods allow for identification of previously unknown processes, explanations of why and how phenomena occur, and the range of their effects (Pasick et al. 2009). Mixed methods research, then, is more than simply collecting qualitative data from interviews, or collecting multiple forms of qualitative evidence (e.g., observations and interviews) or multiple types of quantitative evidence (e.g., surveys and diagnostic tests). It involves the intentional collection of both quantitative and qualitative data and the combination of the strengths of each to answer research questions. (Creswell et al., 2011, p. 5; emphases added)
Why Use Mixed Methods?
As with all methodological choices, the answer depends on your underlying research questions and goals. Mixed methods research is more than just sticking an open-ended question at the end of a quantitative survey. Researchers choose to utilize a mixed methods approach for both pragmatic and synergistic reasons. That is, they use both methods because it makes sense with their research questions and because they will get the answers they want by combining the two approaches. Some research questions are better answered by the strengths of the mixed methods approach. Small (2011) discusses the use of mixed methods as a confirmation or complement of one set of findings from one method by another. Creswell and Clark (2017) note the following situations as being particularly aided by combining qualitative and quantitative data collection and analysis: (1) when you need to obtain both more complete (need for qualitative) and more corroborated (need for quantitative) information; (2) when you need to explain (need for qualitative) initial results (quantitative); (3) when you need to do an exploratory study (need for qualitative) before you can really create and administer a survey or other instrument (quantitative); (4) when you need to describe and compare different types of cases to get a more holistic understanding of what is going on; (5) when you need (or very much want!) to include participants in the study, adding in qualitative elements as you build a quantitative design; (6) when you need all the tools at your disposal to develop, implement, and evaluate a program.
Please note what is not included in this list: because you can. Mixed methods research is not always preferable, even if in general it makes your study “stronger.” Strength is not the only criterion for quality or value. Many students assume that the mixed methods approach is optimal because it includes both qualitative and quantitative research. That is the wrong way of looking at things. Mixed methods are optimal when and only when they fit the necessities of your research question (e.g., How can I corroborate this interesting finding from my interviews so that proper solutions can be fashioned?) or underlying goal (e.g., How can I make sure to include the people in this program as participants of the study?).
If you are just starting out and learning your way through designing your first study, mixed methods are not default requirements. In fact, starting with only one method is probably preferrable, as you can focus on making that design as high-quality as possible. That doesn’t mean you have to stop there, though. As you will see in the next section on design, mixed methods studies often happen sequentially rather than consecutively, so even if you start with one study or method, later on, if you want to add (mix) another approach for the sake of strength or validity or “corroboration” (if you are adding quantitative) or “explanation” (if you are adding qualitative), you can always do that then, after the completion of your first study.
Mixed-Methods Research Designs
If we are using more than one method, how exactly do we do this, and when? The how and the when will depend largely on why we are using mixed methods. For example, if we want to corroborate findings emerging from interviews, then we obviously begin with interviews and follow with, perhaps, a large survey. On the other hand, if we are seeking to explain findings generated from a survey, we begin with that survey and add interviews or observations or focus groups after its completion. And if we are seeking to include participants in the research design itself, we may want to work concurrently, interviewing and holding focus groups as surveys are administered. So, it all depends on why we have chosen to use mixed methods.
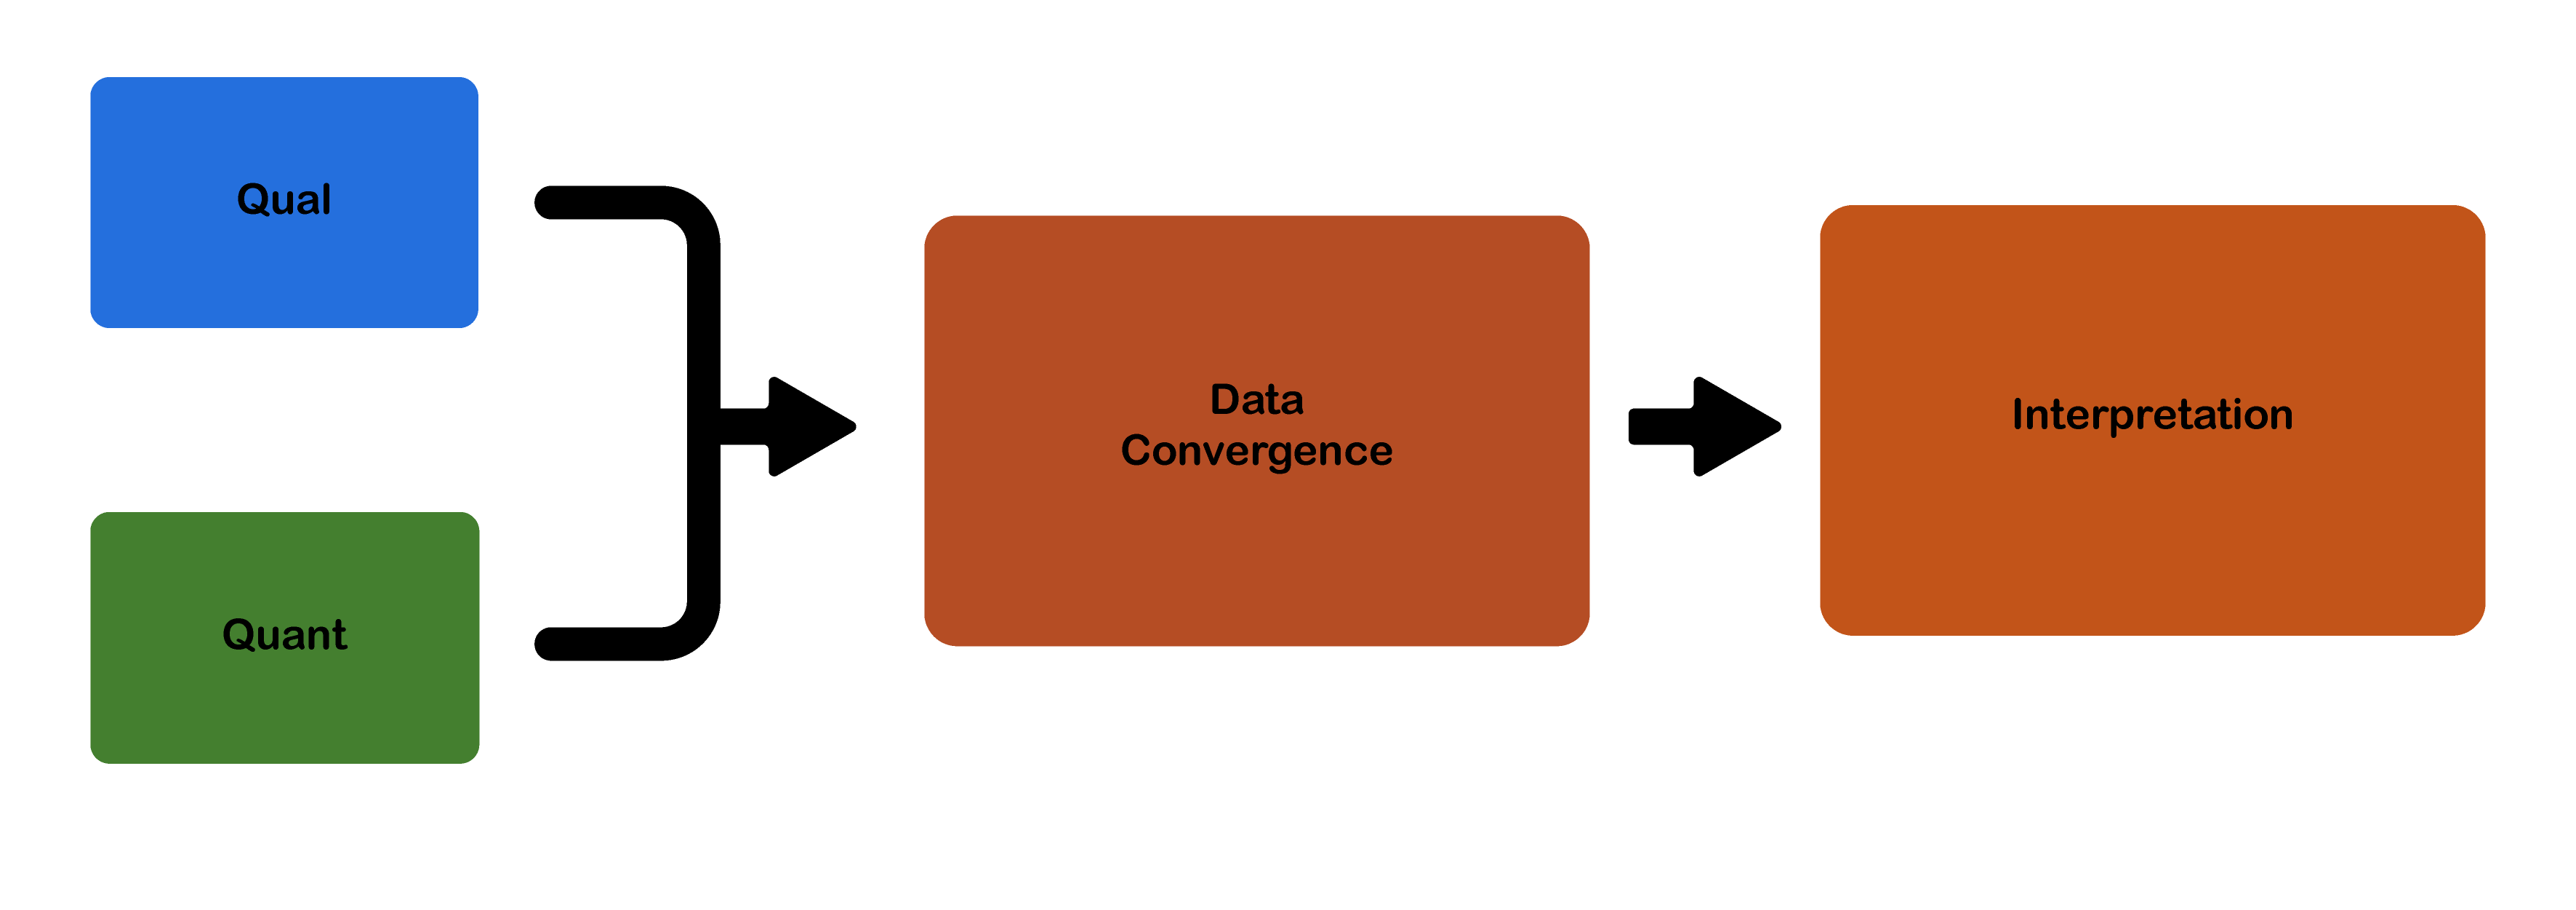
We can think of our choices here in terms of three possibilities. The first, called sequential explanatory, begins with quantitative data (collection) and then follows with qualitative data (collection). After both are collected, interpretations are made. The second, called sequential exploratory, begins the other way around, with qualitative followed by quantitative. After both are collected, interpretations are made. The third, called concurrent triangulation, conceives of both quantitative and qualitative elements happening concurrently. In practice, one may still happen before the other, but one does not follow the other. The data then converge, and from that convergence, interpretations are made.
In sequential explanatory design (below), we are asking ourselves, “In what ways do the qualitative findings explain the quantitative results?” (Creswell et al., 2017). This design thus gives some priority to the quantitative data. The qualitative data, collected after the quantitative data, is used to provide a better understanding of the research problem and then the quantitative data alone.
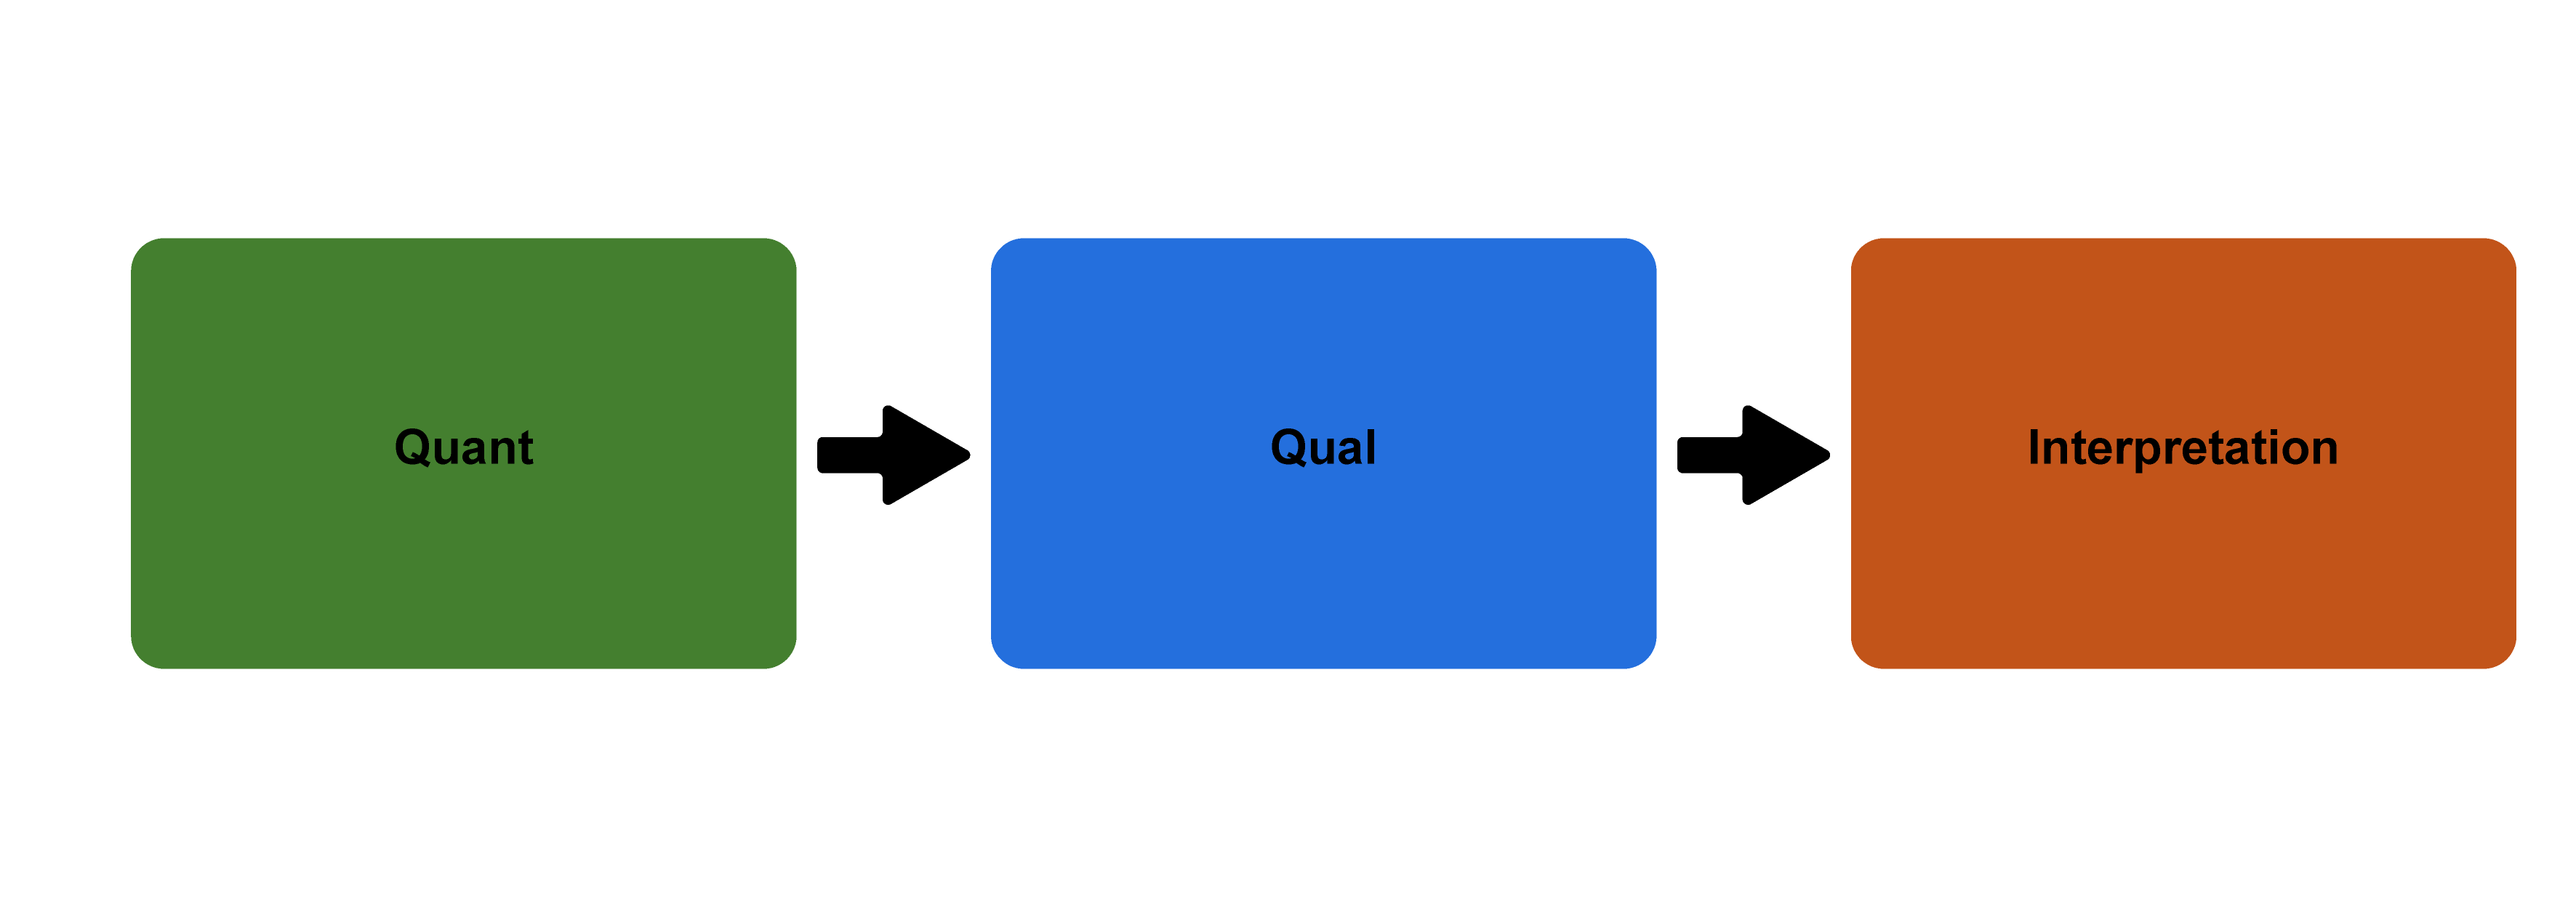
Often, this means providing some context or explaining meanings and motivations behind the correlations found in the quantitative data. For example, a study on college students (Hurst, 2019) found a statistical correlation between upper-middle-class female students and study abroad. In other words, class and gender could be used to predict who studied abroad. But the study couldn’t fully explain why with the survey data collected. To answer these (and other) questions that the survey results raised, the researcher began interviewing students and holding focus groups. And it was through these qualitative forms of data collection that they found a partial answer: upper-middle-class female students had been taught to see study abroad as a final “finishing” component of their education in a way that other students simply had not. They often had mothers who had done the same. And they clearly saw connections here to the kinds of well-traveled cosmopolitan adults they wanted to become.
In sequential exploratory design (below), we are asking ourselves, “In what ways do the quantitative findings generalize (or confirm) the qualitative results?” (Creswell et al., 2018). This design thus gives some priority to the qualitative data. The quantitative data, collected after the qualitative data, is used to confirm the findings.
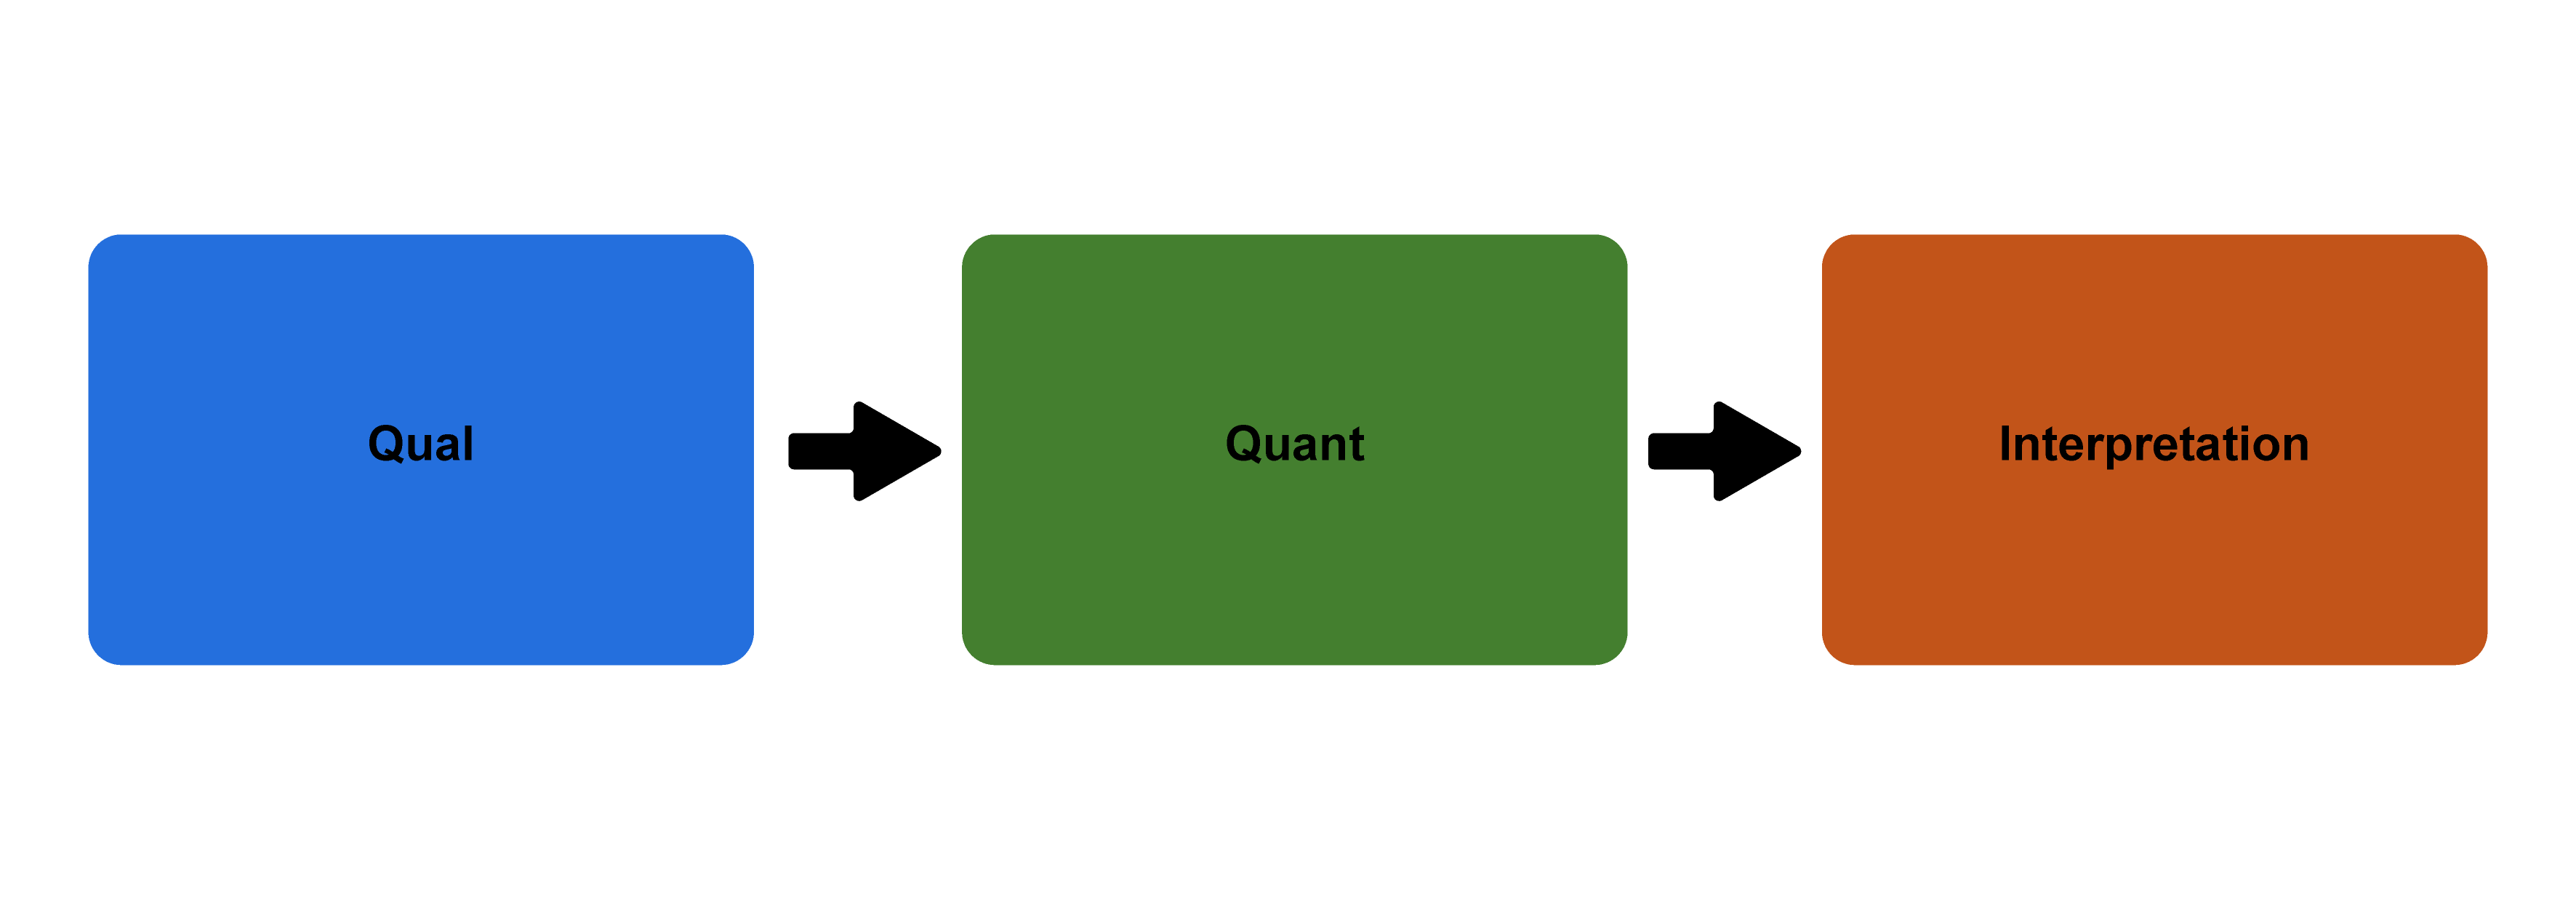
This approach is ideal for developing new instruments or when a researcher intends to generalize findings from a qualitative study to different groups or populations. The American Sociological Association (ASA) Task Force on First-Generation and Working-Class Persons wanted to understand how class background may have played a role in the success of sociology graduate students and faculty. Because this was a relatively new research question, the task force began by conducting several focus groups, asking general questions about how class might have affected careers in sociology. Based on several recurring findings (e.g., high debt burdens, mentorship, feelings of fit), the task force developed a survey instrument that it then administered to more than one thousand sociologists, thus generalizing the preliminary findings and providing corroboration of some of the key variables at play.
In concurrent triangulation design (below), neither the quantitative nor the qualitative component takes precedence. Although in practice one might precede the other in time, neither is the tail that wags the dog, so to speak. They are both the dog. The general of this design is to better understand or deepen one’s understanding of the phenomenon under study. The goal is to obtain different but complementary data that strengthen (validate) the overall results.
These designs might be either nested or nonnested. In a nested design, a subsample of an original randomized sample is used for further interviews or observation. A common nested design form is where in-depth interviews are conducted with a subsample of those who filled out a survey. Nonnested designs occur when it is impractical or impossible to recruit the same individuals that took place in the survey. The research conducted for the book Amplified Advantage (Hurst, 2019) is an example of this. Dr. Hurst supplemented a large national survey of college students and recent college graduates with interviews and focus groups of similar college students and graduates who were not participants in the study (or who may have been randomly selected as participants but without the researcher’s explicit knowledge or linking their data). Nonnested designs are much more flexible than nested designs, but they eliminate the possibility of linking data across methods.
Finally, there is what we might call the recursive design model (below), in which you combine both explanatory and exploratory sequential design.
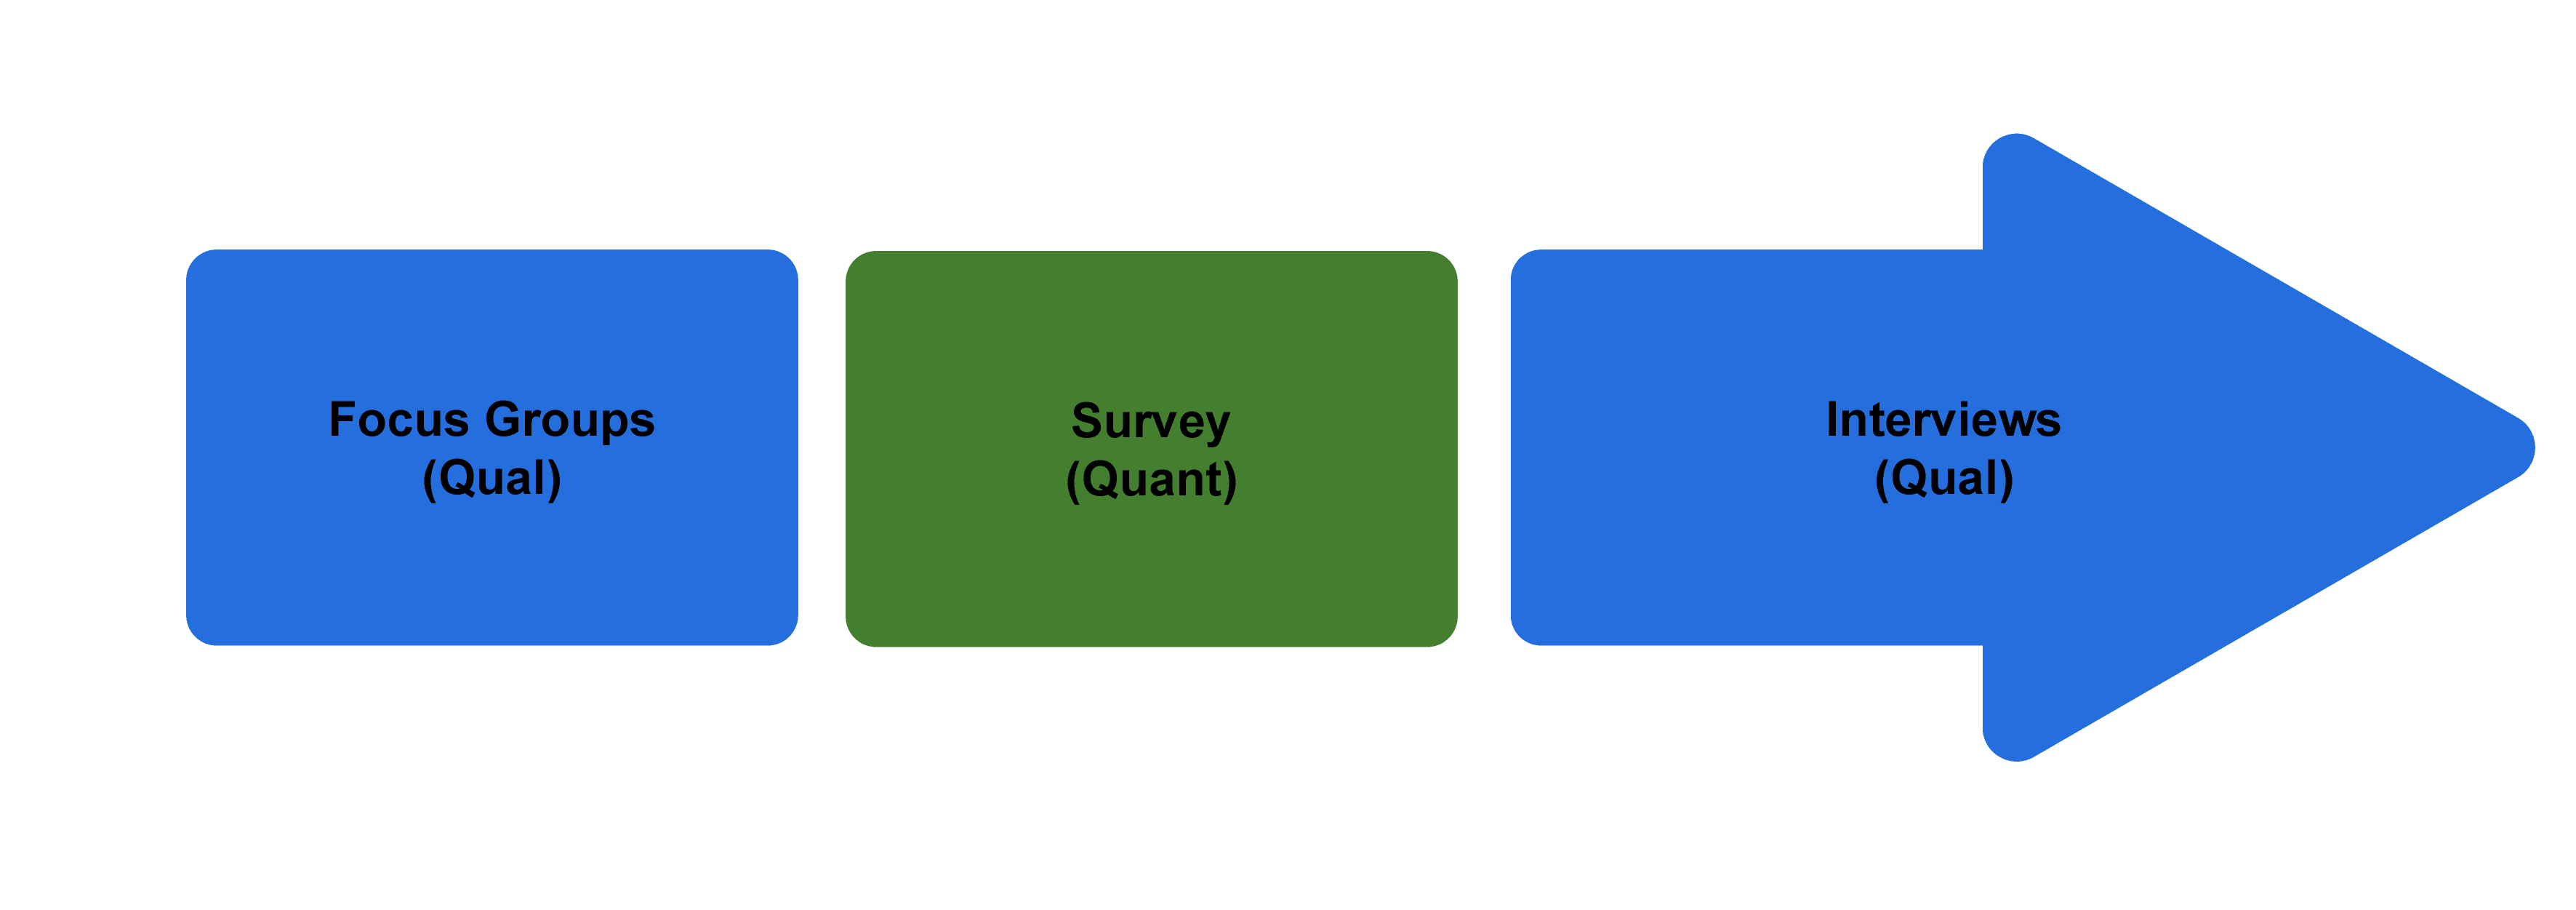
This design is currently being used by the ASA task force mentioned above. The first stage of data collection involved several focus groups. From these focus groups, they constructed a survey that was administered to ASA members. The focus group survey could be viewed as an example of exploratory sequential design. As the surveys were being analyzed, they added a nested set of interviews with persons who had taken the survey and who indicated a willingness to participate in this later stage of data collection. These interviews then help explain some of the findings from the survey. The entire process took several years, however, and involved multiple researchers!
Caution
As with all research design, it is important to think about how best to address your particular research question. There are strengths and weaknesses of each design. Sequential mixed-methods design allows for the collection and analysis of different methods separately, which can make the process more manageable. Sequential designs are relatively easy to implement, design, and report. Sequential exploratory designs allow you to contextualize and generalize qualitative findings to larger samples, while sequential explanatory designs enable you to gain a deeper understanding of findings revealed by quantitative data analysis. All sequential design takes a lot of time, however. You are essentially doubling your research. This is why these are not recommended to undergraduate students or graduate students in master’s programs. In contrast, concurrent mixed-methods designs, whose dual methods may be conducted simultaneously, may be conducted more quickly. However, as a practical matter, you will probably end up focusing first on one data collection method and then the other, so the time saved might be minimal. Concurrent design can also preclude following up on interesting findings that emerge from one side of the study, and the abbreviated form may prevent clarification of confusing issues that arise during analysis. If the results are contradictory or diverge, it may also be difficult to integrate the data. You might end up with more questions to pursue for further study and not much conclusive to say at the end of all your work. Before beginning a mixed methods project, you should have a clear vision for what the project will entail and how each methodology will contribute to that vision; if one method will suffice for a first step, don’t feel pressured to immediately combine methods when one will contribute important knowledge on its own.
Referenecs
Brewer, J., & Hunter, A. (1989). Multimethod research: A synthesis of styles. Newbury Park, CA: Sage
Creswell, J. W., Klassen, A. C., Plano Clark, V. L., & Clegg Smith, K. (2011). Best practices for mixed methods research in health sciences. Office of Behavioral and Social Sciences Research. https://obssr.od.nih.gov/sites/obssr/files/Best_Practices_for_Mixed_Methods_Research.pdf.
Creswell, J. W., & Plano Clark, V. L. (2017). Designing and conducting mixed methods research. 3rd ed. SAGE.
Creswell, J. W., & Poth, C. (2018). Qualitative inquiry and research design: Choosing among five traditions. 4th ed. SAGE.
Hurst, A. L. (2019). Amplified advantage: Going to a “good” college in an era of inequality. Rowman & Littlefield: Lexington Books.
Small, M. L. (2011). How to conduct a mixed methods study: Recent trends in a rapidly growing literature. Annual Review of Sociology, 37, 57–86.
Tashakkori, A., & Teddlie, C. (1998). Mixed methodology: Combining qualitative and quantitative approaches. Thousand Oaks, CA: Sage.
