Coding
The goal of qualitative data analysis is to reach some inferences, lessons, or conclusions by condensing large amounts of data into relatively smaller, more manageable bits of understandable information. Analysis of qualitative data often works inductively (Glaser & Strauss, 1967; Charmaz, 2006). [1] To move from the specific observations a researcher collects to identifying patterns across those observations, qualitative researchers will often begin by reading through transcripts and trying to identify codes.
Coding is the process of breaking down your data into smaller meaningful units. Just like any story is made up by the bringing together of many smaller ideas, you need to uncover and label these smaller ideas within each piece of your data. After you have reviewed each piece of data you will go back and assign labels to words, phrases, or pieces of data that represent separate ideas that can stand on their own. Identifying and labeling codes can be tricky. When attempting to locate units of data to code, look for pieces of data that seem to represent an idea in-and-of-itself; a unique thought that stands alone. For additional information about coding, check out this brief video from Duke’s Social Science Research Institute on this topic. It offers a nice concise overview of coding and also ties into our previous discussion of memoing to help encourage rigor in your analysis process.
As suggested in the video[9], when you identify segments of data and are considering what to label them ask yourself:
- How does this relate to/help to answer my research question?
- How does this connect with what we know from the existing literature?
- How does this fit (or contrast) with the rest of my data?
A code is “a word or short phrase that symbolically assigns a summative, salient, essence-capturing, and/or evocative attribute for a portion of language-based or visual data” (Saldaña 2014:5). Codes can be applied to particular sections of or entire transcripts, documents, or even videos. For example, one might code a video taken of a preschooler trying to solve a puzzle as “puzzle,” or one could take the transcript of that video and highlight particular sections or portions as “arranging puzzle pieces” (a descriptive code) or “frustration” (a summative emotion-based code). If the preschooler happily shouts out, “I see it!” you can denote the code “I see it!” (this is an example of an in vivo, participant-created code). As one can see from even this short example, there are many different kinds of codes and many different strategies and techniques for coding, but much of this depth is beyond the scope of this book. For now, the point to remember is that coding is a rigorous systematic process—to some extent, you are always coding whenever you look at a person or try to make sense of a situation or event, but you rarely do this consciously. Coding is the process of naming what you are seeing and how you are simplifying the data so that you can make sense of it in a way that is consistent with your study and in a way that others can understand and follow and replicate. Another way of saying this is that a code is “a researcher-generated interpretation that symbolizes or translates data” (Vogt et al. 2014:13).
As with qualitative data analysis generally, coding is often done recursively, meaning that you do not merely take one pass through the data to create your codes. Saldaña (2014) differentiates first-cycle coding from second-cycle coding. The goal of first-cycle coding is to “tag” or identify what emerges as important codes. Note the word “emerges”—you don’t always know from the beginning what will be an important aspect of the study or not, so the coding process is really the place for you to begin making the kinds of notes necessary for future analyses. In second-cycle coding, you will want to be much more focused—no longer gathering wholly new codes but synthesizing what you have into metacodes.
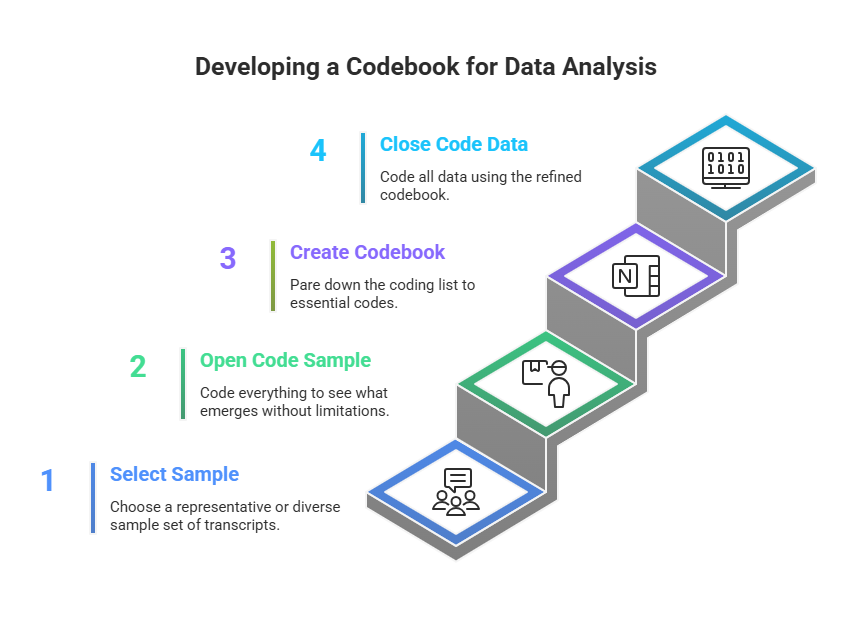
You might also conceive of the coding process in four parts (figure 18.1). First, identify a representative or diverse sample set of interview transcripts (or fieldnotes or other documents). This is the group you are going to use to get a sense of what might be emerging. In my own study of career obstacles to success among first-generation and working-class persons in sociology, I might select one interview from each career stage: a graduate student, a junior faculty member, a senior faculty member.
* This image was created using napkin.ai; however, the concept, design direction, and creative vision were conceived by Dr. Knight
Second, code everything (“open coding”). See what emerges, and don’t limit yourself in any way. You will end up with a ton of codes, many more than you will use at the end, but this is an excellent way to not foreclose an interesting finding too early in the analysis. Note the importance of starting with a sample of your collected data, because otherwise, open coding all your data is, frankly, impossible and counterproductive. You will just get stuck in the weeds.
Third, pare down your coding list. Where you may have begun with fifty (or more!) codes, you probably want no more than twenty remaining. Go back through the weeds and pull out everything that does not have the potential to bloom into a nicely shaped garden. Note that you should do this before tackling all of your data. Sometimes, however, you might need to rethink the sample you chose. Let’s say that the graduate student interview brought up some interesting gender issues that were pertinent to female-identifying sociologists, but both the junior and the senior faculty members identified as male. In that case, I might read through and open code at least one other interview transcript, perhaps a female-identifying senior faculty member, before paring down my list of codes.
This is also the time to create a codebook if you are using one. Do you remember learning about codebooks for quantitative data? Turns out they’re useful for qualitative data too! In this case, the codebook is simply a document that lists and describes the codes you are using. It is easy to forget what you meant the first time you penciled a coded notation next to a passage, so the codebook allows you to be clear and consistent with the use of your codes. There is not one correct way to create a codebook, but generally speaking, the codebook should include (1) the code (either name or identification number or both), (2) a description of what the code signifies and when and where it should be applied, and (3) an example of the code to help clarify (2). Listing all the codes down somewhere also allows you to organize and reorganize them, which can be part of the analytical process. It is possible that your twenty remaining codes can be neatly organized into five to seven master “themes.” Codebooks can and should develop as you recursively read through and code your collected material.
Fourth, using the pared-down list of codes (or codebook), read through and code all the data (close or focused coding). Many qualitative researchers work without a codebook, but it is still a good practice, especially for beginners. At the very least, read through your list of codes before you begin this “closed coding” step so that you can minimize the chance of missing a passage or section that needs to be coded. Defining codes adds meaning to your data and develops a way to talk about your findings. Researchers must ensure that codes are applied in a uniform way in the entire data set during focused coding. It is common for new codes to emerge and for definitions to shift during open coding. The researcher should keep an open mind and allow the definitions of codes to emerge from reading (and re-reading) the data. However, once focused coding begins, the definitions should not change for any reason. Any deviation will make the data analysis less trustworthy. If there are pieces of data that do not fit with your definition, then it is important to note those deviant cases in your final report. The final step is…to do it all again. Or, at least, do close coding (step four) again. All of this takes a great deal of time, and you should plan accordingly.
Note that there is no magic in any of this, nor is there any single “right” way to code or any “correct” codes. What you see in the data will be prompted by your position as a researcher and your scholarly interests. Where the above codes on a preschooler solving a puzzle emerged from my own interest in puzzle solving, another researcher might focus on something wholly different. A scholar of linguistics, for example, may focus instead on the verbalizations made by the child during the discovery process, perhaps even noting particular vocalizations (incidence of grrrs and gritting of the teeth, for example). Your recording of the codes you used is the important part, as it allows other researchers to assess the reliability and validity of your analyses based on those codes.
Saldaña (2014) lists seven “necessary personal attributes” for successful coding. To paraphrase, they are the following:
- Having (or practicing) good organizational skills
- Perseverance
- The ability and willingness to deal with ambiguity
- Flexibility
- Creativity, broadly understood, which includes “the ability to think visually, to think symbolically, to think in metaphors, and to think of as many ways as possible to approach a problem” (20)
- Commitment to being rigorously ethical
- Having an extensive vocabulary
Using multiple researchers to code the same dataset can be quite helpful. Another coder may catch the things that you miss, like something that a participant said. Similarly, another coder may notice if you unknowingly shift your understanding of what a code means. If multiple researchers are coding the dataset simultaneously, researchers must come to a consensus about the meaning of each code and ensure that codes are applied consistently by each researcher. This might remind you of some of the discussions of reliability in earlier chapters when talking about quantitative data. In a similar way here, having raters come to a consensus allows for inter-rater reliability. Even if only one person will code the dataset, it is important to work with other researchers. If other researchers have the time, you may be able to have them check your work for trustworthiness and authenticity. We discussed these standards for methodological rigor for both quantitative and qualitative data in Chapter 5. Remember that the researcher is the measurement instrument in qualitative data analysis: They determine what is true, what is connected, and what it all means.
As tedious and laborious as it might seem to read through hundreds of pages of transcripts multiple times, getting started with the coding process is the hardest part. If you find yourself struggling to identify themes at the open coding stage, ask yourself some questions about your data. The answers should give you a clue about what sorts of themes or categories you are reading. In their text on analyzing qualitative data, Lofland and Lofland (1995) [3] identify a set of questions you might find useful when coding qualitative data. They suggest asking the following:
- Of what topic, unit, or aspect is this an instance?
- What question about a topic does this item of data suggest?
- What sort of answer to a question about a topic does this item of data suggest (i.e., what proposition is suggested)?
Asking yourself these questions about the passages of data that you’re reading can help you begin to identify and name potential themes and categories.
Still feeling uncertain about how this process works? Sometimes it helps to see how qualitative data translate into codes. In the table below, you can see two codes that emerged from an inductive analysis of transcripts from interviews with child-free adults. Also included is a brief description of each code and a few (of many) interview excerpts from which each code was developed.
| Code | Code definition | Interview excerpts |
| Reify gender | Participants reinforce heteronormative ideals in two ways: (a) by calling up stereotypical images of gender and family and (b) by citing their own “failure” to achieve those ideals. | “The woman is more involved with taking care of the child. [As a woman] I’d be the one waking up more often to feed the baby and more involved in the personal care of the child, much more involved. I would have more responsibilities than my partner. I know I would feel that burden more than if I were a man.” |
| “I don’t have that maternal instinct.” | ||
| “I look at all my high school friends on Facebook, and I’m the only one who isn’t married and doesn’t have kids. I question myself, like if there’s something wrong with me that I don’t have that.” | ||
| “I feel badly that I’m not providing my parents with grandchildren.” | ||
| Resist Gender | Participants resist gender norms in two ways: (a) by pushing back against negative social responses and (b) by redefining family for themselves in a way that challenges normative notions of family. | “Am I less of a woman because I don’t have kids? I don’t think so!” |
| “I think if they’re gonna put their thoughts on me, I’m putting it back on them. When they tell me, ‘Oh, Janet, you won’t have lived until you’ve had children. It’s the most fulfilling thing a woman can do!’ then I just name off the 10 fulfilling things I did in the past week that they didn’t get to do because they have kids.” | ||
| “Family is the group of people that you want to be with. That’s it.” |
As you might imagine, wading through data is quite a process. Just as quantitative researchers rely on the assistance of special computer programs to help sort and analyze their data, so too do qualitative researchers. Where quantitative researchers have SPSS and Excel (and many others), qualitative researchers have programs such as NVivo (http://www.qsrinternational.com) and Atlas.ti (http://www.atlasti.com). These are programs specifically designed to assist qualitative researchers with organizing, managing, sorting, and analyzing large amounts of qualitative data. The programs allow researchers to import transcripts from electronic files and then label or code passages, cut and paste passages, search for various words or phrases, and organize complex interrelationships among passages and codes. They even include advanced features that allow researchers to code multimedia files, visualize relationships between a network of codes, and count the number of times a code was applied.
Writing Analytic Memos during/after Coding
Coding the data you have collected is only one aspect of analyzing it. Too many beginners have coded their data and then wondered what to do next. Coding is meant to help organize your data so that you can see it more clearly, but it is not itself an analysis. Thinking about the data, reviewing the coded data, and bringing in the previous literature (here is where you use your literature review and theory) to help make sense of what you have collected are all important aspects of data analysis. Analytic memos are notes you write to yourself about the data. They can be short (a single page or even a paragraph) or long (several pages). These memos can themselves be the subject of subsequent analytic memoing as part of the recursive process that is qualitative data analysis.
Short analytic memos are written about impressions you have about the data, what is emerging, and what might be of interest later on. You can write a short memo about a particular code, for example, and why this code seems important and where it might connect to previous literature. For example, you could write a paragraph about a “cultural capital” code that you use whenever a working-class sociologist says anything about “not fitting in” with their peers (e.g., not having the right accent or hairstyle or private school background). You could then write a little bit about Bourdieu, who originated the notion of cultural capital, and try to make some connections between his definition and how you’re applying it here. You can also use the memo to raise questions or doubts you have about what you are seeing (e.g., Maybe the type of school belongs somewhere else? Is this really the right code?). Later on, you can incorporate some of this writing into the theory section of the final paper or article. Here are some types of things that might form the basis of a short memo: something you want to remember, something you noticed that was new or different, a reaction you had, a suspicion or hunch that you are developing, a pattern you are noticing, any inferences you are starting to draw. Rubin (2021) advises, “Always include some quotation or excerpt from your dataset…that set you off on this idea. It’s happened to me so many times—I’ll have a really strong reaction to a piece of data, write down some insight without the original quotation or context, and then [later] have no idea what I was talking about and have no way of recreating my insight because I can’t remember what piece of data made me think this way” (203).
All CAQDAS programs include spaces for writing, generating, and storing memos. You can link a memo to a particular transcript, for example. But you can just as easily keep a notebook at hand in which you write notes to yourself, if you prefer the more tactile approach. Drawing pictures that illustrate themes and patterns you are beginning to see also works. The point is to write early and write often, as these memos are the building blocks of your eventual final product.
This chapter has given you an idea of the process of data analysis, but there is much yet to learn about the elements of that process – as we’ve said many times before, if this interests you, seek out opportunities to learn more or get hands-on practice!
References
Glaser, B. G., & Strauss, A. L. (1967). The discovery of grounded theory: Strategies for qualitative research. Chicago, IL: Aldine.
Charmaz, K. (2006). Constructing grounded theory: A practical guide through qualitative analysis. Thousand Oaks, CA: Sage.
Saldaña, Johnny. 2014. The Coding Manual for Qualitative Researchers. Thousand Oaks, CA: SAGE.
Vogt, W. Paul, Elaine R. Vogt, Dianne C. Gardner, Lynne M. Haeffele. 2014. Selecting the Right Analyses for Your Data: Quantitative, Qualitative, and Mixed Methods. New York: The Guilford Press.
Lofland, J., & Lofland, L. H. (1995). Analyzing social settings: A guide to qualitative observation and analysis (3rd ed.) Belmont, CA: Wadsworth. ↵
Rubin, Ashley T. 2021. Rocking Qualitative Social Science: An Irreverent Guide to Rigorous Research. Palo Alto, CA: Stanford University Press.
