Measurement Quality
Measurement Quality
Once you’ve done the hard work of identifying a construct and creating an appropriate and usable operational definition or working definition, you’re still not yet ready to stick your measure into a research plan and go! Before we apply a measure and start collecting data, we need to be sure (or as sure as we can be) that our measures are high quality. For quantitative data, this means the measure has good psychometric properties. These properties include reliability and validity, each of which encompass a few different kinds of their measure. Qualitative data also needs to be high-quality, but has different measures of this quality, which we’ll talk more about below.
Assessing psychometric properties is asking “are we measuring what we think we’re measuring accurately?” with our tools. All measures must be tested for their ability to measure what they’re supposed to; for a scale or similar physical measurement tool, we would likely call that calibration. Measures of abstract concepts like emotional well being or family closeness can also be calibrated and tested to help researchers (and research readers) that they’re measuring what they’re supposed to measure however many times the measurement is taken. Reliability asks if we’re measuring things in a replicable way, and validity asks if we’re actually on target for what we think we’re trying to measure.
Let’s say our interest is in measuring the concepts of alcoholism and alcohol intake. What are some potential problems that could arise when attempting to measure this concept, and how might we work to overcome those problems?
Reliability
First, let’s say we’ve decided to measure alcoholism by asking people to respond to the following question: Have you ever had a problem with alcohol? If we measure alcoholism this way, then it is likely that anyone who identifies as an alcoholic would respond “yes.” This may seem like a good way to identify our group of interest, but think about how you and your peer group may respond to this question. Would participants respond differently after a wild night out, compared to any other night? Could an infrequent drinker’s current headache from last night’s glass of wine influence how they answer the question this morning? How would that same person respond to the question before consuming the wine? In each cases, the same person might respond differently to the same question at different points, so it is possible that our measure of alcoholism has a reliability problem. Reliability in measurement is about consistency.
Let’s Break it Down
Show
Reliability
* This image was created using ChatGPT; however, the concept, design direction, and creative vision were conceived by Dr. Knight
In the simplest of terms:
Reliability means your tool or survey gives you the same results each time you use it, as long as nothing has changed.
It’s like a thermometer: if you take your temperature three times in a row and you’re not sick or moving around, it should show the same number each time. That’s reliability.
Dr. Christie Knight
One common problem of reliability with social scientific measures is memory. If we ask research participants to recall some aspect of their own past behavior, we should try to make the recollection process as simple and straightforward for them as possible. Sticking with the topic of alcohol intake, if we ask respondents how much wine, beer, and liquor they’ve consumed each day over the course of the past 3 months, how likely are we to get accurate responses? Unless a person keeps a journal documenting their intake, there will very likely be some inaccuracies in their responses. On the other hand, we might get more accurate responses if we ask a participant how many drinks of any kind they have consumed in the past week.
Reliability can be an issue even when we’re not reliant on others to accurately report their behaviors. Perhaps a researcher is interested in observing how alcohol intake influences interactions in public locations. They may decide to conduct observations at a local pub by noting how many drinks patrons consume and how their behavior changes as their intake changes. What if the researcher has to use the restroom, and the patron next to them takes three shots of tequila during the brief period the researcher is away from their seat? The reliability of this researcher’s measure of alcohol intake depends on their ability to physically observe every instance of patrons consuming drinks. If they are unlikely to be able to observe every such instance, then perhaps their mechanism for measuring this concept is not reliable.
If the measure yields consistent results when given multiple times, then the measure is considered to reliable. For example, if you took the SATs on multiple occasions before coming to school, your scores should be relatively the same from test to test. This is what is known as test-retest reliability. In the same way, a person who suffers from clinical depression should score similar results on a depression scale today and a few days from now.
Additionally, you may need to assess inter-rater reliability if your study involves observing people’s behaviors. Inter-rater reliability is the degree to which different observers agree on what happened. For instance, let’s say your study involves observing sessions of mothers interacting with infants. Did you miss when the mother dismissed the infant when he was offering her an object? Did the other person rating miss that event? Do you both similarly rate the parent’s engagement with the child? Again, scores of multiple observers should be consistent, though perhaps not perfectly identical.
Finally, internal consistency reliability is an important concept when dealing with scales. The scores on each question of a scale should be correlated with each other, as they all measure parts of the same concept. Think about a scale of depression, like Beck’s Depression Inventory (BDI). A person who is depressed would score highly on most of the measures, but there would be some variation. For example, we would imagine that there would be a correlation between scores on mood disturbance and lack of enjoyment if we administered the BDI to a group. They aren’t the same concept, but they are related, so there should be a mathematical relationship between them. A specific statistical test known as Cronbach’s Alpha provides a way to measure how well each question of a scale is related to the others.
Test-retest, inter-rater, and internal consistency are three important subtypes of reliability. Researchers use these types of reliability to make sure their measures are consistently measuring the concepts in their research questions.
Validity
While reliability is about consistency, validity is about accuracy. What image comes to mind for you when you hear the word alcoholic? Are you certain that your image is similar to the image that others have in mind? If not, then we may be facing a problem of validity.
For a measure to have validity, it must accurately reflect the meaning of our concepts. Think back to when we initially considered measuring alcoholism by asking research participants if they have ever had a problem with alcohol. We realized that this might not be the most reliable way of measuring alcoholism because the same person’s response might vary dramatically depending on how they are feeling that day. Likewise, this measure of alcoholism is not particularly valid. What is “a problem” with alcohol? For some, it might be having had a single regrettable or embarrassing moment that resulted from consuming too much. For others, the threshold for “problem” might be different. Perhaps a person does not believe that they have an alcohol problem, although they have had numerous embarrassing drunken moments. As you can see, there are countless ways that participants could define an alcohol problem. If we are trying to objectively understand how many of our research participants are alcoholics, then this measure may not yield any useful results. Of course, though, if our interest is in how many research participants perceive themselves to have a problem, then our measure may be just fine.
Let’s Break it Down
Show
Validity
In the simplest of terms:
Validity means your test or tool actually measures what it’s supposed to measure.
Let’s say you want to measure marital satisfaction.
If you ask people, “How often do you mow the lawn?” — that question isn’t valid because it doesn’t really tell you about how happy they are in their marriage.
But if you ask, “How satisfied are you with the communication in your relationship?” — that’s a valid question because it relates to the actual concept of marital satisfaction.
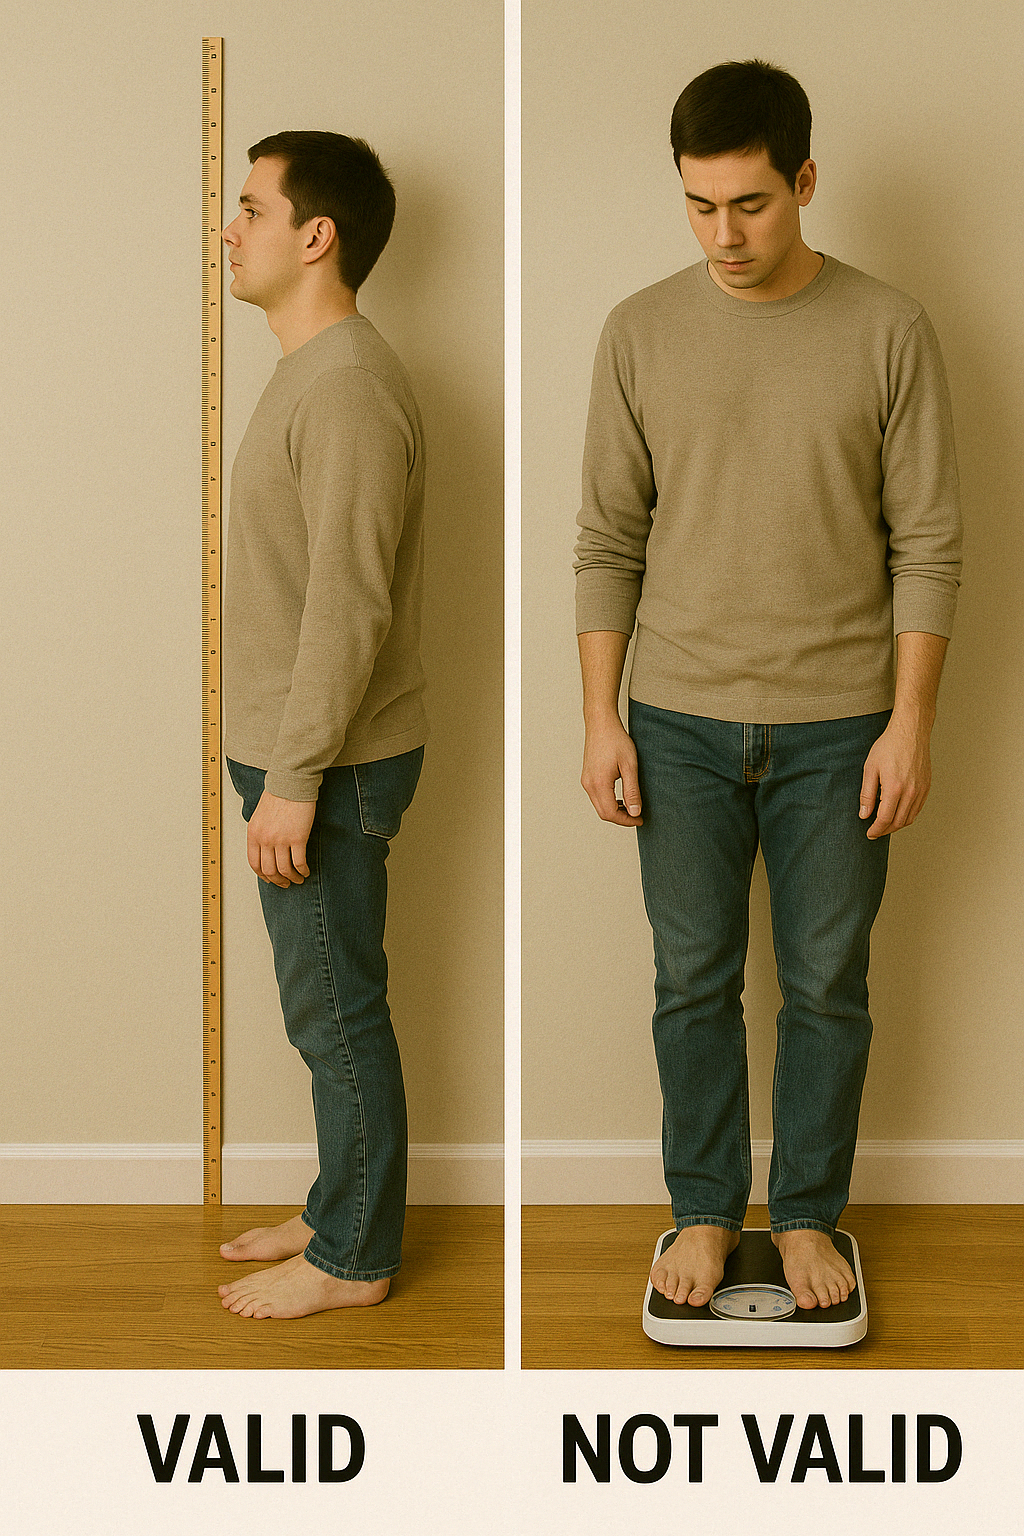
* This image was created using ChatGPT; however, the concept, design direction, and creative vision were conceived by Dr. Knight
Think of it like this:
If you’re trying to measure how tall someone is, a ruler is valid.
But if you try to measure their height with a bathroom scale, that’s not valid—even if the scale gives a consistent number (which would be reliable, but not valid).
Dr. Christie Knight
In the last paragraph, critical engagement with our measure for alcoholism “Do you have a problem with alcohol?” was shown to be flawed. We assessed its face validity or whether it is plausible that the question measures what it intends to measure. Face validity is a subjective process. Sometimes face validity is easy, as a question about height wouldn’t have anything to do with alcoholism. Other times, face validity can be more difficult to assess. Let’s consider another example.
Perhaps we’re interested in learning about a person’s dedication to healthy living. Most of us would probably agree that engaging in regular exercise is a sign of healthy living. We could measure healthy living by counting the number of times per week that a person visits their local gym, but perhaps they visit the gym to use the tanning beds, flirt with potential dates, or sit in the sauna. While these activities are potentially relaxing, they are probably not the best indicators of healthy living. Therefore, recording the number of times a person visits the gym may not be the most valid way to measure their dedication to healthy living.
In addition, this measure of healthy living is problematic because it is incomplete. Content validity assesses whether the measure includes all of the possible meanings of the concept. Think back to the previous section on multidimensional variables. Healthy living seems like a multidimensional concept that might need an index, scale, or typology to measure it completely. Our one question on gym attendance doesn’t cover all aspects of healthy living. Once you have created one, or found one in the existing literature, you need to assess for content validity. Are there other aspects of healthy living that aren’t included in your measure?
Let’s say you have created (or found) a good scale, index, or typology to measure healthy living. For example, a valid measure of healthy living might be able to predict future blood panel test scores. This is called predictive validity, and it means that your measure predicts things it should be able to predict. In this case, our measure predicts that if you have a healthy lifestyle, then a standard blood test administered in a few months would show healthy results. If we were to administer the blood panel measure at the same time as the scale of healthy living, we would be assessing concurrent validity. Concurrent validity is the similar to predictive validity, except that both measures are given at the same time.
Another closely related concept is convergent validity. In assessing for convergent validity, you should look for existing measures of the same concept, for example the Healthy Lifestyle Behaviors Scale (HLBS). If you give someone your scale and the HLBS at the same time, their scores should be similar. Convergent validity compares your measure to an existing measure of the same concept. If the scores are similar, then it’s likely that they are both measuring the same concept. Discriminant validity is a similar concept, except you would be comparing your measure to one that is entirely unrelated. A participant’s scores on your healthy lifestyle measure shouldn’t be statistically correlated with a scale that measures knowledge of the Italian language.
These are the basic subtypes of validity, though there are certainly others you can read more about. Think of validity like a portrait: Some portraits look just like the person they are intended to represent, but other representations like caricatures and stick drawings are not nearly as accurate. A portrait may not be an exact representation of how a person looks, but the extent to which it resembles the subject is important. The same goes for validity in measures: No measure is exact, but some measures are more accurate than others.
If we picture measurement like trying to hit a target, reliability and validity help us determine where our darts land. Specifically, good reliability of a measure means that we should measure the same thing multiple times or with multiple people doing the measuring (depending on the type of reliability we’re interested in), and if we apply this to darts it means that when we throw multiple darts they should hit the same area. The tighter the spread of darts, the more reliable our throwing is. Validity, on the other hand, translates to darts by looking to see if our darts even hit the target. If they’re off in the bushes somewhere or stuck to the wall next to the board, they aren’t getting onto the target. Similarly, we could be aiming to measure something specific (let’s say, for example, marital quality), but if our measure is invalid, we could end up measuring something else entirely (say, commitment).
Quality Qualitative Measurement
As was mentioned earlier in this module, issues of measurement are more often quantitative issue than a qualitative one. That’s largely because qualitative research has much more room for building understanding and advancing new interpretations as the research progresses, whereas, for quantitative data, the measurement needs to be established early. The quality of qualitative measurement is still a concern; however, it’s measured in a different way than quantitative measures.
Trustworthiness and authenticity
The standards for measurement are different in qualitative and quantitative research for an important reason. Measurement in quantitative research is done objectively or impartially. That is, the researcher has minimal influence over the measurement process. They simply choose a measure, apply it, and read the results. Therefore, the accuracy and consistency depend on the measure rather than the researcher.
Differently, qualitative researchers are deeply involved in the data analysis process. There are no external measurement tools, like quantitative scales, rather the researcher is the measurement instrument. Researchers build connections between different ideas that participants discuss and draft an analysis that accurately reflects the depth and complexity of what participants have said. This is challenging for researchers, as it involves acknowledging their own various biases and allowing the meaning that participants shared to emerge as the data is read. This process is not concerned with objectivity, for there is always some subjectivity in qualitative analysis. We are more concerned with researchers rigorously engaging in the data analysis process.
For this reason, researchers speak of rigor in more personal terms. Trustworthiness refers to the “truth value, applicability, consistency, and neutrality” of the results of a research study (Rodwell, 1998, p. 96). Authenticity refers to the degree to which researchers capture the multiple perspectives and values of their participants and foster change across participants and systems during their analysis. Both trustworthiness and authenticity contain criteria that help a researcher gauge the rigor with which the study was conducted.
When discussing validity and reliability, we must think about trustworthiness. Criteria for trustworthiness include credibility, dependability, and confirmability. Credibility refers to the accuracy of the results and the degree to which participants viewed them as important and believable. Qualitative researchers will often consult with participants before finalizing and publishing their results to make sure participants agree with them (this process is called member checking). They may also seek assistance from another qualitative researcher to review or audit their work. As you might expect, it’s difficult to view your own research without bias, so another set of eyes is often helpful. Unlike in quantitative research, the ultimate goal is not to find the Truth (with a capital T) using a predetermined measure, but to create a credible interpretation of the data.
Credibility is akin to validity, as it mainly speaks to the accuracy of the research product. On the other hand, the criteria of credibility is similar to reliability. As we just reviewed, reliability is the consistency of a measure. If you give the same measure each time, you should get similar results. However, qualitative research questions, hypotheses, and interview questions may change during the research process. How can reliability be achieved under such conditions?
The procedures of qualitative data analysis include the principle of emergence, so there isn’t a need for everyone to get the exact same questions each time. Indeed, because qualitative research understands the importance of context, it would be impossible to control all things that make a qualitative measure the same when given to each person. The location, timing, or even the weather can influence participants to respond differently. To assess dependability, researchers ensure that the study followed proper qualitative procedures and they also justify, describe, and account for any changes that emerge during the research process in their final report. Researchers should keep a journal or log to document any changes to their methodology as well as their justification. In addition, researchers may consult another qualitative researcher to examine their logs and results to ensure dependability.
Finally, the criteria of confirmability refers to the degree to which the results reported are linked to the data obtained from participants. While it is possible for another researcher to view the same data and come up with a different analysis, confirmability ensures that a researcher’s results are grounded in what participants said. Another researcher should be able to read the results of your study and trace each point back to something specific that one or more participants shared. This process is called an audit.
The criteria for trustworthiness were created as a reaction to critiques of qualitative research as unscientific (Guba, 1990). They demonstrate that qualitative research is equally as rigorous as quantitative research. Subsequent scholars conceptualized the dimension of authenticity without referencing the standards of quantitative research at all. Instead, they wanted to understand the rigor of qualitative research on its own terms. What comes from acknowledging the importance of the words and meanings that people use to express their experiences?
While there are multiple criteria for authenticity, the most important for undergraduate social researchers is fairness. Fairness refers to the degree to which “different constructions, perspectives, and positions are not only allowed to emerge, but are also seriously considered for merit and worth” (Rodwell, 1998, p. 107). Depending on their design, qualitative researchers may involve participants in the data analysis process, attempt to equalize power dynamics among participants, and help negotiate consensus on the final interpretation of the data. As you can see from the talk of power dynamics and consensus-building, authenticity attends to the justice elements of social research.
After fairness, the criteria for authenticity become more radical, focusing on transforming individuals and systems examined in the study. For our purposes, it is important for you to know that qualitative research and measurement are conducted with the same degree of rigor as quantitative research. The standards may be different, but they speak to the goals of accurate and consistent results that reflect the views of the participants in the study.
Measurement Protocol
Beyond defining a measure and choosing a method, the actual protocol of how one administers a measure can also play a role in how well the measure does its job. Unfortunately, measures never perfectly describe what exists in the real world. Good measures demonstrate validity and reliability but will always have some degree of error. Systematic error causes our measures to consistently output incorrect data, usually due to an identifiable process. Imagine you created a measure of height, but you didn’t put an option for anyone over six feet tall. If you gave that measure to your local college or university, some of the taller students might not be measured accurately. In fact, you would be under the mistaken impression that the tallest person at your school was six feet tall, when in actuality there are likely people taller than six feet at your school. This error seems innocent, but if you were using that measure to help you build a new building, those people might hit their heads! This is an example of a ceiling effect, in which the highest point of measurement isn’t high enough to capture what’s needed; a floor effect is just the opposite – the measure’s lower bound is not low enough to capture everyone at that end of the scale. Sensitivity refers the ability of a measure to actually pick up differences. Sometimes this is a matter of having a quality measure (if a thermometer can’t tell the difference between 98 °F and 101°F you will have problems detecting a fever) and sometimes it’s a matter of being precise in measurement (if you’re looking at children’s verbal ability at different ages but measure age in whole years you won’t get as much detail as you would if you measured age in months or even weeks). Looking at prior research to get a sense of risks for ceiling or floor effects can be helpful, and for sensitivity, consider what kind of change is meaningful for your question; is a different in seconds required, or would you learn enough from differences measured in hours or even days (or more)?
A less innocent form of error arises when researchers word questions in a way that might cause participants to think one answer choice is preferable to another. For example, if someone was to ask you “Do you think global warming is caused by human activity?” you would probably feel comfortable answering honestly. But what if they asked you “Do you agree with 99% of scientists that global warming is caused by human activity?” Would you feel comfortable saying no, if that’s what you honestly felt? Unlikely. That is an example of a leading question, a question with wording that influences how a participant responds.
In addition to error created by the researcher, your participants can cause error in measurement. Some people will respond without fully understanding a question, particularly if the question is worded in a confusing way. Let’s consider another potential source or error. If we asked people if they always washed their hands after using the bathroom, would we expect people to be perfectly honest? Polling people about whether they wash their hands after using the bathroom might only elicit what people would like others to think they do, rather than what they actually do. This is an example of social desirability bias, in which participants in a research study want to present themselves in a positive, socially desirable way to the researcher. People in your study will want to seem tolerant, open-minded, and intelligent, but their true feelings may be closed-minded, simple, and biased. Participants may lie in this situation. This occurs often in political polling, which may show greater support for a candidate from a minority race, gender, or political party than actually exists in the electorate.
Another risk from the researcher’s side is expectancy bias, which occurs when a researcher already expects to see a certain thing in the measurement, so they’re more apt to record that thing than they should be if they were objective (think of it like confirmation bias). One of the best ways to prevent experimenter bias is to not have the main researcher administer measures when there’s a risk of bias (have a research assistant do that part) and to standardize all measurement protocols, meaning that each participant is treated and measured the exact same way following a set of written instructions that each researcher is trained and comfortable with.
A related form of bias, but from the participant’s end, is called acquiescence bias, also known as “yea-saying.” It occurs when people say yes to whatever the researcher asks, even when doing so contradicts previous answers. For example, a person might say yes to both “I am a confident leader in group discussions” and “I feel anxious interacting in group discussions.” Those two responses are unlikely to both be true for the same person. Why would someone do this? Similar to social desirability, people want to be agreeable and nice to the researcher asking them questions or they might ignore contradictory feelings when responding to each question. Respondents may also act on cultural reasons, trying to “save face” for themselves or the person asking the questions. Regardless of the reason, the results of your measure don’t match what the person truly feels.
So far, we have discussed sources of error that come from choices made by respondents or researchers. Usually, systematic errors will result in responses that are incorrect in one direction or another. For example, social desirability bias usually means that the number of people who say they will vote for a third party in an election is greater than the number of people who actually vote for that candidate. Systematic errors such as these can be reduced, but random error can never be eliminated. Unlike systematic error, which biases responses consistently in one direction or another, random error is unpredictable and does not consistently result in scores that are consistently higher or lower on a given measure. Instead, random error is more like statistical noise, which will likely average out across participants.
Random error is present in any measurement. If you’ve ever stepped on a bathroom scale twice and gotten two slightly different results, maybe a difference of a tenth of a pound, then you’ve experienced random error. Maybe you were standing slightly differently or had a fraction of your foot off of the scale the first time. If you were to take enough measures of your weight on the same scale, you’d be able to figure out your true weight. In social science, if you gave someone a scale measuring depression on a day after they lost their job, they would likely score differently than if they had just gotten a promotion and a raise. Even if the person were clinically depressed, our measure is subject to influence by the random occurrences of life. Thus, social scientists speak with humility about our measures. We are reasonably confident that what we found is true, but we must always acknowledge that our measures are only an approximation of reality.
Humility is important in scientific measurement, as errors can have real consequences. We can do our best to reduce errors by carefully planning our measurement (and looking to prior research for examples of what works and what doesn’t), but we always have to keep in mind that there may be other explanations out there.
Pilot Tests and Cognitive Interviews
Two methods that strengthen measurement protocols are pilot tests and cognitive interviews. These are important because they allow you to test measurement in action before implementing it for real.
Cognitive interviews are useful especially for self-report measures, that is, measures where someone is answering questions about themselves, often in a questionnaire. For a cognitive interview, a very small number of people (possibly just one person) who are similar to the desired sample for the study are selected to complete the survey instrument in a controlled environment. Often, they take the survey at a table or computer while a researcher sits next to them and watches them take it. The interviewee is asked to “think out loud” while they complete the questionnaire, noting anything that is confusing, verbalizing their interpretation of each question, and noting any visceral reactions that arise in response to a question. The researcher sitting next to the participant often records and takes notes and may prompt the interviewee to say more or delve into a particular question deeper.
The cognitive interview allows researchers an inside view into the heads of how participants might interpret the questions and instructions. It can help the researcher know where to add additional instructions, where to change a term, or where respondents may be likely to break off of a study because a question is especially sensitive or prompts an emotional reaction (in which case it might, for example, help for the survey to include a small statement before that particular question reminding respondents that they can skip a question if they need to).
Pilot testing is good for most, if not all, study designs because it’s an opportunity for everyone to practice and make sure things work before running the study in the full anticipated sample (which can sometimes be hundred or thousands of participants). For a pilot test, the researcher or research team runs the study but only on a very tiny proportion of the participants they’ll eventually want. They may collect a little bit of information about the study experience itself through the process, but mainly they’re running things like a dress rehearsal just to make sure it works. Having the resulting pilot data is also useful, because you can conduct preliminary analysis on it to make sure all the data you want is there and correct your measures if they’re not complete or are not displaying good reliability or validity (few things are more disheartening than conducting a study and realizing you forgot to include an important variable in your measures or finding out an important measure has terrible reliability).

.jpg)