Studies of Studies
In this section, let’s consider two research methods that might feel as different from each other as possible: meta-analysis, which often brings together thousands of data points (or more!), and single-subjects designs, also called “n of 1″ studies because the sample size is, you guessed it, one. Both have their place in research, and bring some of the data collection techniques we’ve already discussed into interesting territory.
Meta-analysis
Existing data can be used in a number of ways; as we’ve discussed before, you can research in an archive, analyze the content of published (and unpublished) work, and examine the evidence left behind by human behavior. As a further example of this, let’s talk about a unique method for analyzing data across multiple studies. Sometimes called a study-of-studies, a meta-analysis uses prior research studies as the data in their own, new, analysis. A researcher using meta-analysis takes all those other findings, enters the data from those studies into a dataset, and statistically analyzes them to come up with an overall result that has much higher power than the other results did alone due to the increased sample size. These studies are different than papers like “systematic literature reviews” or even a content analysis because they literally combine the results of the prior studies to generate new statistical results, rather than just studying what’s been written before and synthesizing or analyzing the information that way. As we’ve discussed before, one research study alone can only tell us so much about a question or problem. Meta-analyses take many small drops and apply their techniques to get a better sense of the big picture on a topic.
The kinds of issues that occur when collecting data from individuals can also occur when collecting data from existing documents, especially in the case of meta analysis. The most obvious problem that might cross both techniques is selection bias. When looking for information from existing data, be careful to understand what’s being contributed as well as what’s not. This is know as the file-drawer problem (also called publication bias) because when meta-analytic researchers are gathering the studies that they want to use as data, it’s likely they’ll only get part of all the research done on a topic if they focus only on studies that have been published. Research that didn’t “work” for some reason – the results weren’t exciting, or didn’t align with the hypothesis, or didn’t go all the way through publication for one reason or another – is likely locked up in someone’s file drawer somewhere (or more likely languishing on a cloud server nowadays). This is an issue for any existing data design, but especially when the goal is to collect all the data on a given question to re-analyze them all together, we can’t rely only on what a researcher can find in published sources. Often, researchers conducting meta-analyses will reach out to other researchers in the field to help find the data in file drawers, by having researchers who study the topic share even their unpublished data, and they can also conduct sophisticated analysis to estimate what data are missing from the picture. This can go a long way in helping make meta-analyses as strong as possible.
Let’s take a moment to examine how one meta-analysis dealt with the file drawer problem and what it meant for their results. When Dr. Elizabeth Fawcett and colleagues (2010) wanted to study how well premarital education programs worked for improving couple satisfaction and communication, they used a meta-analysis to combine the results from all the studies they could find on the topic. Their search (described in detail in a companion article, Hawkins et al., 2008), included not only general research databases, but also the reference lists of other meta-analysis and literature reviews. To find those studies that might not have been published, the authors searched a dissertation database (as, if you’ll recall from our discussion of types of literature, dissertation studies are not required to be peer-reviewed to be published in their university’s database) and also “made extensive efforts over the course of 2 years at national conferences and through e-mail to contact researchers and practitioners to find unpublished (and in-press) reports” (p. 725). By searching thoroughly and not assuming that all the data they needed would be published, they were able to collect a number of sources they might not otherwise have found. Because of this, they were able to show that including the unpublished studies mattered a great deal for the conclusions to be taken!
Basically, using existing data for our research means that we must acknowledge that the data we find exist for a reason, and that there are likely data that don’t exist but should and would change our interpretations if they did. You might have heard the phrase “history is written by the victors,” and it can be the case here too that the documents and other records we find were often produced by only certain groups or individuals. Even if it was produced, some data don’t survive as long as others, which can also contribute to missing perspectives. Asking yourself what’s missing is a useful strategy to take when evaluating existing data designs, especially meta-analyses.
Single-subjects design
Can research be done with a sample of one?
Single-subjects design is distinct from other research methodologies in that, as its name indicates, only one person is being studied. Since many interventions, especially those in mental health, often involves one-on-one practice, single-subjects designs are often used by interventionists to ensure that their efforts are having a positive effect. While the results will not be generalizable, they do provide important insight into the effectiveness of clinical interventions. Single-subjects designs involve repeated measurements over time, usually in two stages. They may be qualitative or quantitative, and often have a mix of both to more fully flesh out the story of the participant.
The baseline stage is the period of time before the intervention starts. During the baseline stage, the interventionist would be looking for a pattern to emerge. For example, a person with substance abuse issues may binge drink on the weekends but cut down their drinking during the work week. A substance abuse social worker may ask a client to record their alcohol intake, and they would probably notice this pattern after a few weeks. Ideally, social workers would start measuring a client for a little while before starting their intervention to discover this pattern naturally. Unfortunately, that may be impractical or unethical to do in practice. A retrospective baseline can be attained by asking the client to recollect a few weeks before the intervention started, though it likely to be less reliable than a baseline recorded in real time. The baseline is important because unlike in experimental design, there is no control group. Thus, we must see if our intervention is effective by comparing the client before and during treatment.
The next stage is the treatment stage, and it refers to the time in which the treatment is administered by the social worker. Repeated measurements are taken during this stage to see if your treatment is having the intended effect. But what exactly are we measuring in single-subjects design? Continuing with our example of substance abuse, the social worker could measure the number of drinks that their client consumes in a night. In this example, we should assume that the client’s binge drinking is identified as a problem by the client and it’s a part of their treatment plan. By looking at the number of drinks they consume, we could evaluate the level of alcohol consumption— for example, by looking at how close they are to dangerously high levels of intoxication. We could look for trends— perhaps the client is in crisis and their drinking getting worse by the day. We may also look at variability, like when their binge drinking is most profound—on weekends or when they are around certain family members.
Generally, the measure is graphed on an X-Y axis like in Figure 15.1. The x-axis is time, as measured in days. The y-axis is the problem we’re trying to change, our dependent variable. In Figure 15.1 below, the y-axis is our client’s count of the number of drinks per day. Our client did not receive any treatment for the first fourteen days, or two weeks. This is the baseline phase, and we can see the pattern emerge in their drinking. They drink to excess on the weekends. Once our treatment has started on day 15, we can see that pattern decrease somewhat, indicating the treatment is starting to work.
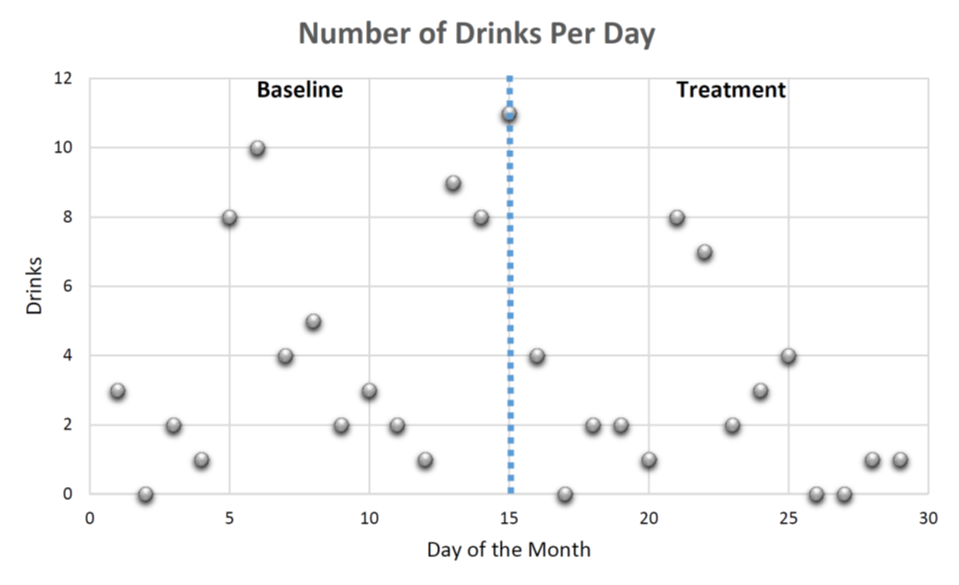
By visualizing the data in this way, we can identify patterns for analysis. For example, it looks like our client engages in binge drinking on a weekly basis. Days 5-6, 12-15, and 21-22 all contain the highest number of drinks. Their level of drinking is more moderate on other days, though the total amount is still worrying. This is known as a trend in the data. The client’s baseline trend is curvilinear, going up for a few days and dipping back down. The baseline phase should extend until a trend is evident. Establishing a trend can prove difficult in clients whose behaviors vary widely. The curvilinear trend reappears in the treatment stage once but does not appear again as expected. This suggests that the intervention may have stopped the client from binging again, though certainly further measurement is warranted to make sure.
Although it may be difficult to see visually, if you do the math, the client consumed about one less drink per day after starting the treatment. On average, the client consumed 3.65 drinks per day in the baseline phase and 2.64 drinks in the treatment phase. While this decrease is encouraging, the client is still engaging in excessive use of alcohol. This may indicate to the social worker that they may want to further refine and target the intervention. If they were to begin a new course of treatment or add a new dimension to the existing treatment, they would be executing a multiple treatment design. For example, let’s say they revised the treatment on day 30. The graphing would continue as before, but with another vertical line on day 30, indicating a new treatment began. Another option would be to withdraw the treatment for fifteen days and continue to measure the client, reestablishing a baseline. If the client continues to improve after the treatment is withdrawn, then it is likely to have lasting effects. Whether that is advisable for the client, given their problematic use and the short time in treatment, it may make sense after a period of sobriety has been achieved – this would be part of the expert judgement of the social worker administering the treatment and documenting the outcomes.
Single-subjects designs, much like evaluation research in the previous section, are used to demonstrate that interventions have their intended effects. Although this may not be how most people think of research, there are times when this is a very appropriate way to contribute knowledge to a discipline. Indeed, there was a time in the history of social work in which single-subjects designs were thought to be a method of creating a new scientific foundation for social work (Kirk & Reid, 2002). [1] Social workers were to be practitioner-researchers whose practice would empirically test various interventions, ensure competence and effective practice, and demonstrate measurable change to clients. Most social workers do not receive extensive training in single-subjects designs. More importantly, practitioners may be too overworked or undercompensated to conduct data collection and analysis, given that it is not a reimbursable activity for insurance companies. This is in contrast to evaluation research, for which data collection and analysis are incorporated as part of the grant funding system. For this reason, the practitioner-researcher divide has been bridged mostly through evaluation research and partnerships between practitioners and academic researchers. Agency administrators partner with researchers to implement and test academic ideas in the real-world.
Single-subjects designs are most compatible with clinical modalities such as cognitive-behavioral therapy which incorporate client self-monitoring, clinician data analysis, and quantitative measurement as parts of treatment. In this therapeutic model, it is routine to track behaviors such as the number of intrusive thoughts experienced between counseling sessions. Moreover, practitioners spend time each session reviewing changes in patterns during the therapeutic process, using it to evaluate and fine-tune the therapeutic approach. Although researchers have used single-subjects designs with less positivist therapies, such as narrative therapy, the single-subjects design is generally used in therapies with more quantifiable outcomes. The results of single-subjects studies are not generalizable to the overall population, but they help ensure that social workers and other providers are not providing useless or counterproductive interventions to their clients.
References
Fawcett, E. B., Hawkins, A. J., Blanchard, V. L., & Carroll, J. S. (2010). Do premarital education programs really work? A meta-analytic study. Family Relations, 59, 232-239. 10.1111/j.1741-3729.2010.00598.x
Hakins, A. J., Blanchard, V. L., Baldwin, S. A., & Fawcett, E. B. (2008). Does marriage and relationship education work? A meta-analytic study. Journal of Consulting and Clinical Psychology, 76(5), 723-734. 10.1037/a0012584
Kirk, S. A. & Reid, W. J. (2002). Science and social work: A critical appraisal. New York, NY: Columbia University Press. ↵
Image copied from DeCarlo, Scientific inquiry in social work.
