Types of Sampling
Generally, we can think of two types of sampling: probability and nonprobability. The differences between these two broad definitions generally have to do with whether or not you know the characteristics of your population of interest and whether you can sample directly from that population of interest, as well as whether or not you really want or need your sample to be representative of that population of interest.
Probability sampling techniques are named that because you do know the probability of any individual in your population being selected for your sample. To do so, you must know how many people are in your population; if you have a population of 100 people and sample with replacement, each individual has a 1/100 probability of being selected for the sample. When taken correctly, probability sampling techniques should produce samples that are relatively representative of their populations. This then makes it possible to use statistics to make inferences from the sample that can be generalized to the population of interest.
Let’s Break it Down
Show
Probability Sampling
In simple terms:
Probability sampling means everyone has the same fair chance of being picked for the study.
* This image was created using ChatGPT; however, the concept, design direction, and creative vision were conceived by Dr. Knight
Example:
A school wants to know how students feel about homework.
They write down the name of every student in the school, mix them up, and randomly pick 50 names.
Each student had the same chance of being chosen—that’s probability sampling!
Dr. Christie Knight
On the other hand, nonprobability sampling is used when you don’t know the probability of selection of an individual from your population into your sample, or you don’t care about generalizing to a population. This may be because you don’t actually know the size of your population – this may be especially important for very small or hidden populations. For example, if you wanted to study illegal drug abusers you probably can’t know exactly how many of them there are in the area you’re interested in studying, and thus would call your population of interest. Nonprobability samples are also useful when you’re not as concerned about the representativeness of your sample to your population. Perhaps you want to investigate the experience of a certain phenomenon, and in this case you just want a very in-depth picture from folks who have lived through that phenomenon. In this case you probably again don’t know the size of the population, so you’re not concerned about representing it, and you need to be sure that the people you’re sampling have had the experience you’re interested in. This particular case is a good candidate for certain types of nonprobablility sampling that we’ll discuss in a moment.
Let’s Break it Down
Show
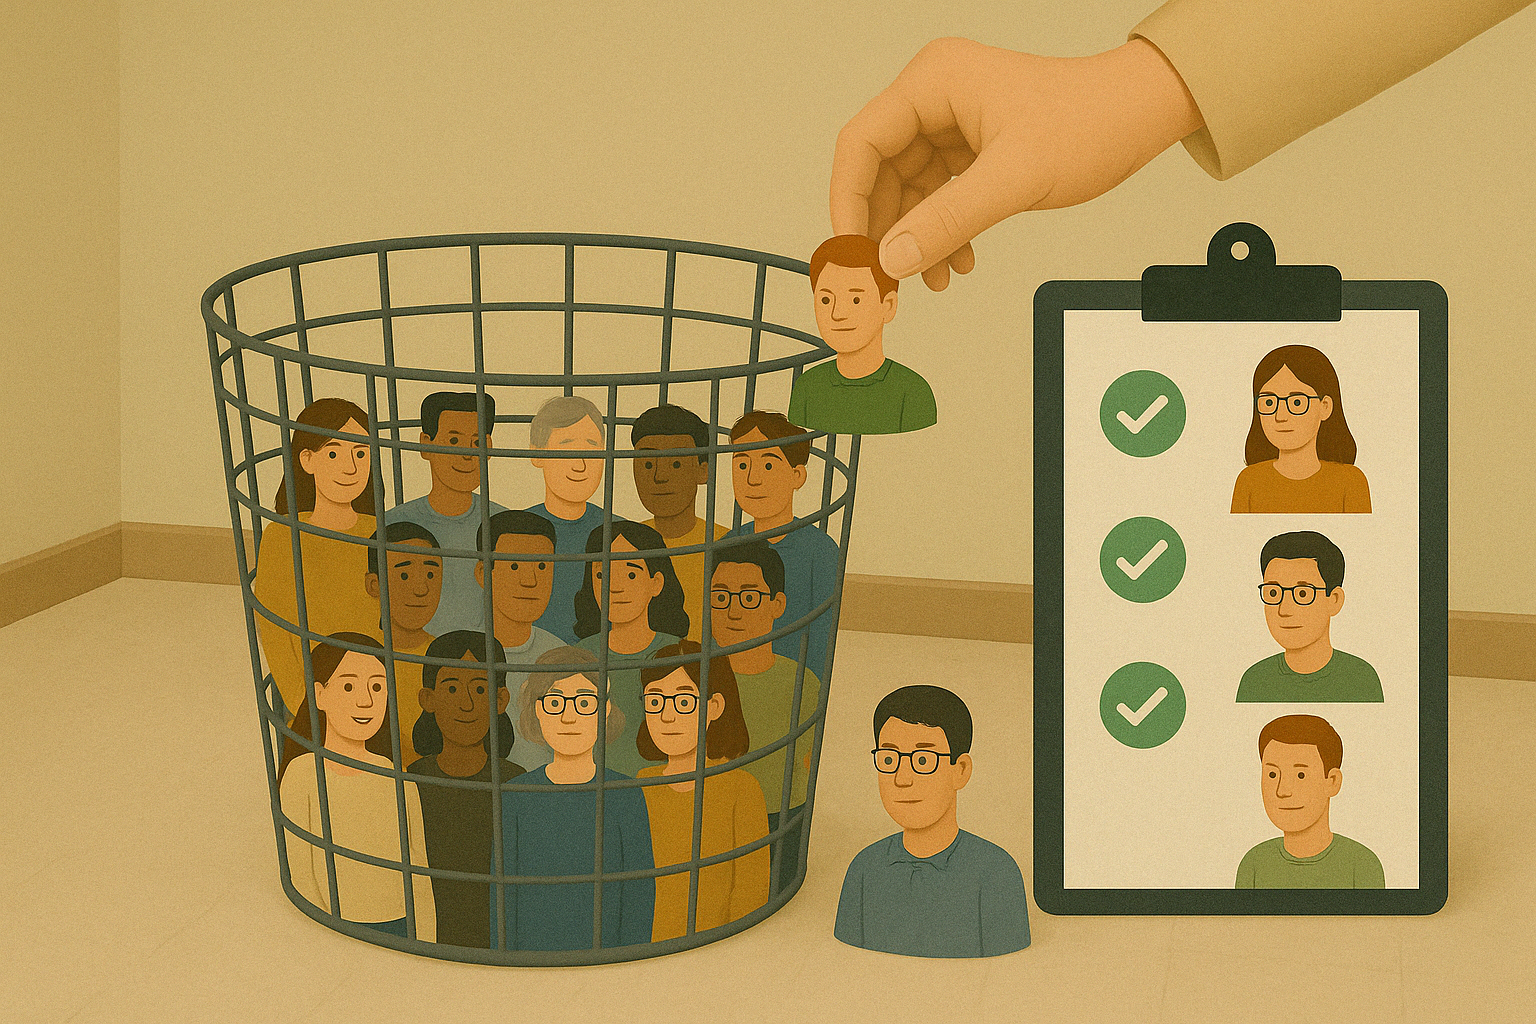
Nonprobability Sampling
In simple terms:
Nonprobability sampling means not everyone has an equal chance of being chosen for the study.
Instead, the researcher selects participants based on factors such as availability or possession of specific knowledge or qualities that align with the study.

* This image was created using ChatGPT; however, the concept, design direction, and creative vision were conceived by Dr. Knight
Example:
A researcher wants to understand how homeless individuals experience access to healthcare.
Because there’s no list of every person experiencing homelessness (so they can’t randomly select people), the researcher goes to a local shelter and interviews whoever is available and willing to talk.
This is nonprobability sampling—not everyone in the homeless community had a chance to be chosen, only those at that shelter at that time.
Dr. Christie Knight
The Researcher’s Toolkit: How I Apply What I Teach
If you’ve been in any of my research methods classes, you’ve probably heard me emphasize the value of random sampling. It’s the gold standard for generalizability, and for good reason—when we can randomly select participants, we reduce bias and strengthen the credibility of our findings.
But sometimes, random sampling simply isn’t possible.
When I designed a study focused on understanding the home environments of adolescent sexual offenders, I quickly realized (with the guidance of the institutional review board) that I couldn’t ethically or practically interview the adolescents themselves. Instead, I shifted my research to those who worked most closely with them—their therapists. Even with this adjustment, random sampling still wasn’t an option. I had to use nonprobability sampling, relying on professional contacts and treatment centers to identify therapists willing and able to participate.
As someone who values methodological rigor, this was a challenging decision, but it was also a necessary one. Working with vulnerable populations—even indirectly—requires researchers to prioritize ethics over ideal sampling conditions. Although my findings weren’t broadly generalizable to all therapists or treatment settings, they offered valuable insights contributing to professional work and educational understanding.
Here’s what I want students to remember: Strong research isn’t about sticking rigidly to a single method—it’s about making thoughtful, ethical decisions that fit the context of your study. Nonprobability sampling isn’t a shortcut; in many cases, it’s the only responsible path forward. When done carefully and transparently, it allows us to ask important questions and contribute valuable knowledge to our fields. _
– Dr. Knight
Sampling Frames and Accessible Populations
One thing to note is that with either type of sampling you do have an intermediary step between the population of interest and your sample. In most probability sample methods, you must identify an appropriate sampling frame. The sampling frame is a list of individuals in your population. You need to have this list so that you know how many people are in the population and so that you can sample directly from the population – that is, directly from the frame. You can also use this list for other purposes, which we’ll describe below in some non-probability methods. Consider if your population of interest lends itself to a sample frame – is it possible to make a list of members?
In a nonprobability sampling situation, the intermediary step is identifying your accessible population. The accessible population is the part of your population that you can, perhaps unsurprisingly, actually access. For an example, think about a study where your population is married couples in the United States. Your accessible population is probably those close to you, geographically, such as married couples in your state, or even in your county. Note that this isn’t your sample – you’re not going to study every married couple in the state – but you will select your sample only from couples in that area, even though your target population was originally married couples in all of the United States.
Let’s delve into some details of each type of sampling now.
Nonprobability Sampling
Let’s first talk about nonprobability sampling techniques. You might have seen these in action before; have you ever seen a sign that says “go to this link to participate in my study!” or had someone try to stop you in a public place to answer a survey? Those are nonprobability methods. These are quite common and especially popular on college campuses. Nonprobability samples, remember, are useful when we don’t know or we don’t care about the size or particular characteristics of the population that we’re studying through our sample. Nonprobability sampling techniques often sample out of convenience or sample on particular characteristics that we need in our participants.
Because nonprobability methods are good for identifying people with particular characteristics or for unique or hidden populations, they can be especially useful for qualitative research questions, but they are by no means limited to qualitative studies only. Qualitative researchers typically make sampling choices that enable them to achieve a deep understanding of the phenomenon they are studying.

When are nonprobability samples ideal? One instance might be when we’re starting a big research project. For example, if we are conducting survey research, we may want to administer a draft of our survey to a few people who resemble the folks we’re interested in studying so they can help work out potential kinks. We might also use a nonprobability sample if we’re conducting a pilot study or exploratory research, as it would be a quick way to gather some initial data and help us get a feel of the lay of the land before conducting a more extensive study. From these examples, we can see that nonprobability samples are useful for setting up, framing, or beginning any type of research, but it isn’t just early-stage research that relies on and benefits from nonprobability sampling techniques. Researchers also use nonprobability samples in full-blown research projects. These projects are usually qualitative in nature, where the researcher’s goal is in-depth, idiographic understanding rather than more general, nomothetic understanding.
Types of nonprobability samples
There are several types of nonprobability samples that researchers use. These include purposive samples, snowball samples, quota samples, and convenience samples. While the latter two strategies may be used by quantitative researchers from time to time, they are more typically employed in qualitative research. They are both nonprobability methods, so we include them in this section of the chapter.
To draw a purposive sample, a researcher selects participants from their accessible population or sampling frame because they have characteristics that the researcher desires. A researcher begins with specific characteristics in mind that they wish to examine and then they seek out research participants who cover that full range of characteristics. For example, if you are studying mental health supports on your campus, you want to be sure to include not only students, but also mental health practitioners and student affairs administrators. You might also select students who currently use mental health supports, those who dropped out of supports, and those who are waiting to receive supports. The ‘purposive’ part of purposive sampling comes from intentionally selecting specific participants because you know they have characteristics that you need in your sample, like being an administrator or dropping out of mental health supports.
Note that these are different than inclusion criteria, which are more general requirements a person must possess to be a part of your sample. For example, one of the inclusion criteria for a study of your campus’ mental health supports might be that participants had to have visited the mental health center in the past year. Differently, purposive sampling assumes that you know individuals’ characteristics and recruit them based on these criteria. For example, you might recruit “Jane” for the study because she stopped seeking supports this month, or maybe you’d recruit JD because they have worked at the center for many years.
Also, it is important to recognize that purposive sampling requires the researcher to have information about the participants prior to recruitment. In other words, you need to know their perspectives or experiences before you know whether you want them in your sample. While many of my students claim they are using purposive sampling by “recruiting people from the health center,” or something along those lines, purposive sampling involves recruiting specific people based on the characteristics and perspectives they bring to your sample. To solidify this concept, let’s imagine we are recruiting a focus group. In this case, a purposive sample might gather clinicians, current patients, administrators, staff, and former patients so they can talk as a group. Purposive sampling would seek out people that have each of those attributes.
Quota sampling takes purposive sampling one step further by identifying categories that are important to the study and for which there is likely to be some variation. In this nonprobability sampling method, subgroups are created based on each category, the researcher decides how many people to include from each subgroup, and then collects data from that number for each subgroup. Let’s consider a study of student satisfaction with on-campus housing. Perhaps there are two types of housing on your campus: apartments that include full kitchens and dorm rooms where residents do not cook for themselves and instead eat in a dorm cafeteria. As a researcher, you might wish to understand how satisfaction varies across these two types of housing arrangements. Perhaps you have the time and resources to interview 20 campus residents, so you decide to interview 10 from each housing type. In addition, it is possible that your review of literature on the topic suggests that campus housing experiences vary by gender. If that is that case, perhaps you’ll decide on four important subgroups: men who live in apartments, women who live in apartments, men who live in dorm rooms, and women who live in dorm rooms. Your quota sample would include five people from each of the four subgroups.
In 1936, up-and-coming pollster George Gallup made history when he successfully predicted the outcome of the presidential election using quota sampling methods. The Literary Digest, the leading polling entity at the time, predicted that Alfred Landon would beat Franklin Roosevelt in the presidential election by a landslide, but Gallup’s polling disagreed. Gallup successfully predicted Roosevelt’s win and subsequent elections based on quota samples, but in 1948, Gallup incorrectly predicted that Dewey would beat Truman in the US presidential election. Among other problems, Gallup’s quota categories did not represent those who actually voted (Neuman, 2007). This underscores the point that one should avoid attempting to make statistical generalizations from data collected using quota sampling methods. While quota sampling offers the strength of helping the researcher account for potentially relevant variation across study elements, it would be a mistake to think of this strategy as yielding statistically representative findings. For that, you need probability sampling, which we will discuss in the next section.
Researchers can also use snowball sampling techniques to identify study participants. In snowball sampling, a researcher identifies one or two people they would like to include in their study but then relies on those initial participants to help identify additional study participants. Thus, the researcher’s sample builds and becomes larger as the study continues, much as a snowball builds and becomes larger as it rolls through the snow. Snowball sampling is an especially useful strategy when a researcher wishes to study a stigmatized group or behavior. For example, a researcher interested in studying how people with genital herpes cope with their medical condition would be unlikely to find many participants by posting an ad in the newspaper or by announcing the study at a social gathering. Instead, the researcher might know someone with the condition, interview that person, and ask the person to refer others they may know with the genital herpes to contact you to participate in the study. Having a previous participant vouch for the researcher may help new potential participants feel more comfortable about being included in the study.
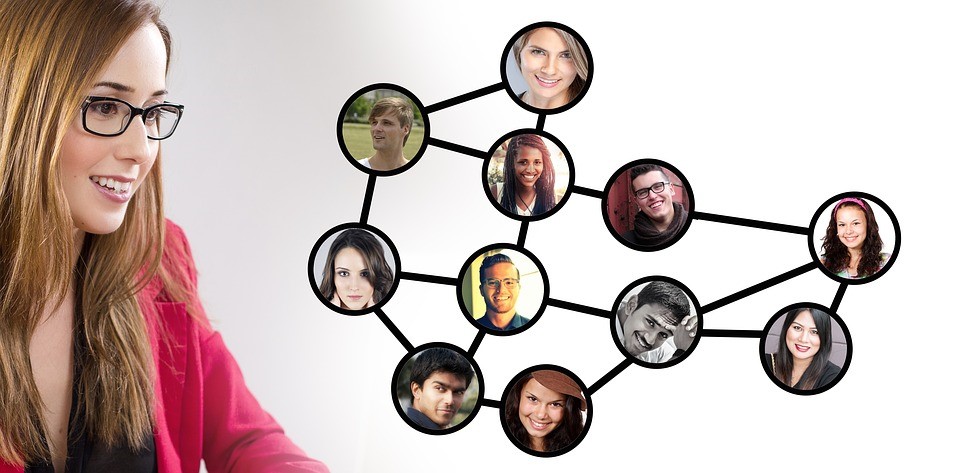
Snowball sampling is sometimes referred to as chain referral sampling. One research participant refers another, and that person refers another, and that person refers another—thus a chain of potential participants is identified. Aside from being a useful strategy for stigmatized groups, snowball sampling is also useful when the interest group may be difficult to find or the group may be relatively rare. This was the case for Steven Kogan and colleagues (Kogan et al., 2011) who wished to study the sexual behaviors of non-college-bound African American young adults who lived in high-poverty rural areas. The researchers initially relied on their own networks to identify study participants, but members of the study’s target population were not easy to find. Access to the networks of initial study participants was very important for identifying additional participants in their situation. Initial participants were given coupons to pass on to others they knew who qualified for the study. Participants were given an added incentive for referring eligible study participants; they received $50 for participating in the study and an additional $20 for each person they recruited who also participated in the study. Using this strategy, Kogan and colleagues succeeded in recruiting 292 study participants.
Finally, convenience sampling is another nonprobability sampling strategy that is employed by both qualitative and quantitative researchers. To draw a convenience sample, a researcher simply collects data from people or other relevant elements that they can access conveniently. Also known as availability sampling, convenience sampling is the most useful in exploratory research or student projects where probability sampling is too costly or difficult. If you’ve ever been interviewed by a fellow student for a class project, you have likely been a part of a convenience sample. While convenience samples offer one major benefit—convenience—they do not offer the rigor needed to make conclusions about larger populations. In the next section on probability sampling, we will discuss this concept in greater detail.
Sample type Description
Purposive Researcher seeks out participants with specific characteristics.
Snowball Researcher relies on participant referrals to recruit new participants.
Quota Researcher selects cases from within several different subgroups.
Convenience Researcher gathers data from whatever cases happen to be convenient.
Can you think of other examples of when a researcher may want to use a nonprobability sampling technique? Sometimes research readers get the idea in their heads that nonprobability sampling happens because researchers are being lazy; perhaps that idea comes from a name like “convenience” sampling. Occasionally convenience sampling could be considered “easier” than other methods – for example, it’s true that some researchers sample from college students because it’s quick and easy to recruit students from Psychology 1010. However, non-probability methods, even convenience sampling, absolutely has its place. There are many populations or specific study designs that lend themselves to nonprobability designs, it’s just that the decision must be made thoughtfully, rather than by default.
Probability Sampling
Probability sampling comes into play, remember, when we do know the probability of an individual being selected into our sample, and this comes when we know the size of a population of interest. Remember to that we must have a useful sampling frame for these types of sampling methods.
In probability sampling we can often take advantage of randomness, which can help with, but does not guarantee, a representative sample. A representative sample means that the sample looks like a miniature version of the population and results from the sample are very readily applied to the population. Quantitative researchers are often interested in making generalizations about groups that are larger than their study samples, which means that they seek nomothetic causal explanations. While there are certainly instances when quantitative researchers rely on nonprobability samples (e.g., when doing exploratory research), quantitative researchers tend to rely on probability sampling techniques. The goals and techniques associated with probability samples differ from those of nonprobability samples. We’ll explore those unique goals and techniques in this section.

Obtaining a representative sample is important in probability sampling because of generalizability. In fact, generalizability is perhaps the key feature that distinguishes probability samples from nonprobability samples. Generalizability refers to the idea that a study’s results will tell us something about a group larger than the sample from which the findings were generated; to be confident in statistical generalization, a researcher must have a clear understanding (and documentation) of each participants’ probability of being selected. Often, it’s done randomly, meaning that every member of the population has an equal chance of being selected. Using random selection does not mean that your sample will be perfect. No sample is perfect. The researcher can only yield perfect results if they include everyone from the target population into the sample, which defeats the purpose of sampling. Generalizing from a sample to a population always contains some degree of error. This is referred to as sampling error, which is the statistical calculation of the difference between results from a sample and the actual parameters of a population.
Generalizability is a pretty easy concept to grasp. Imagine if a professor were to take a sample of individuals in your class to see if the material is too hard or too easy. However, the professor only sampled individuals that had grades over 90% in the class. Would that be a representative sample of all students in the class? That would be a case of sampling error—a mismatch between the results of the sample and the true feelings of the overall class. In other words, the results of the professor’s study don’t generalize to the overall population of the class.
Taking this one step further, imagine your professor is conducting a study on binge drinking among college students. The professor uses undergraduates at your school as their sampling frame. Even the professor used probability sampling methods, your school may differ from other schools in important ways. There are schools that are “party schools” where binge drinking may be more socially accepted, “commuter schools” at which there is little nightlife, and so on. If your professor plans to generalize their results to all college students, then they will have to make an argument that their sampling frame (undergraduates at your school) is representative of the population (all undergraduate college students).
Types of probability samples
There are a variety of probability samples that researchers may use. These include simple random samples, systematic samples, stratified samples, and cluster samples. Let’s build on the previous example. Imagine we were concerned with binge drinking and chose the target population of fraternity members. How might you go about getting a probability sample of fraternity members that is representative of the overall population?

Simple random samples are the most basic type of probability sample. A simple random sample requires a real sampling frame—an actual list of each person in the sampling frame. A school likely has a list of all of the fraternity members on campus, as Greek life is subject to university oversight. You could the university list as your sampling frame. From there, you would sequentially assign a number to each fraternity member, or element, and then randomly select the elements from which you will collect data using a random number generate or random number table.
True randomness is difficult to achieve, and it takes complex computational calculations to do so. Although you think you can select things at random, human-generated randomness is actually quite predictable, as it falls into patterns called heuristics. Researchers must rely on computer-generated assistance to attain a truly random selection.
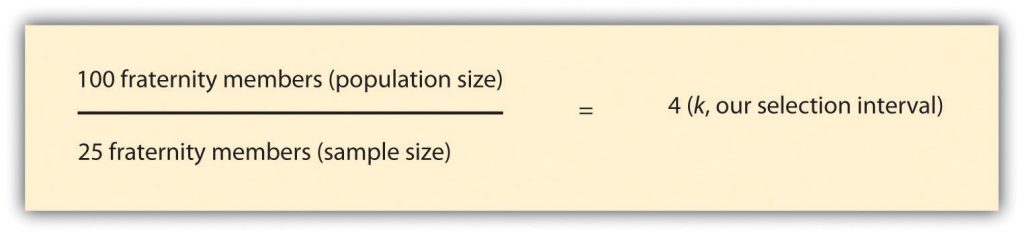
As you might have guessed, drawing a simple random sample can be quite tedious. Systematic sampling techniques are somewhat less tedious but offer the benefits of a random sample. As with simple random samples, you must possess a list of everyone in your sampling frame. To draw a systematic sample, you’d simply select every kth element on sampling frame list. If you are unfamiliar with this concept, k is your selection interval or the distance between the elements you select for inclusion in your study. To begin the selection process, you’ll need to figure out how many elements you wish to include in your sample. Let’s say you want to interview 25 fraternity members on your campus, and there are 100 men on campus who are members of fraternities. In this case, your selection interval, or k, is 4. To arrive at 4, simply divide the total number of population elements by your desired sample size. This process is represented in Figure 10.2.
| Number | Name | Include in study? | Number | Name | Include in study? | |
| 1 | Jacob | 51 | Blake | Yes | ||
| 2 | Ethan | 52 | Oliver | |||
| 3 | Michael | Yes | 53 | Cole | ||
| 4 | Jayden | 54 | Carlos | |||
| 5 | William | 55 | Jaden | Yes | ||
| 6 | Alexander | 56 | Jesus | |||
| 7 | Noah | Yes | 57 | Alex | ||
| 8 | Daniel | 58 | Aiden | |||
| 9 | Aiden | 59 | Eric | Yes | ||
| 10 | Anthony | 60 | Hayden | |||
| 11 | Joshua | Yes | 61 | Brian | ||
| 12 | Mason | 62 | Max | |||
| 13 | Christopher | 63 | Jaxon | Yes | ||
| 14 | Andrew | 64 | Brian | |||
| 15 | David | Yes | 65 | Mathew | ||
| 16 | Logan | 66 | Elijah | |||
| 17 | James | 67 | Joseph | Yes | ||
| 18 | Gabriel | 68 | Benjamin | |||
| 19 | Ryan | Yes | 69 | Samuel | ||
| 20 | Jackson | 70 | John | |||
| 21 | Nathan | 71 | Jonathan | Yes | ||
| 22 | Christian | 72 | Liam | |||
| 23 | Dylan | Yes | 73 | Landon | ||
| 24 | Caleb | 74 | Tyler | |||
| 25 | Lucas | 75 | Evan | Yes | ||
| 26 | Gavin | 76 | Nicholas | |||
| 27 | Isaac | Yes | 77 | Braden | ||
| 28 | Luke | 78 | Angel | |||
| 29 | Brandon | 79 | Jack | |||
| 30 | Isaiah | 80 | Jordan | |||
| 31 | Owen | Yes | 81 | Carter | ||
| 32 | Conner | 82 | Justin | |||
| 33 | Jose | 83 | Jeremiah | Yes | ||
| 34 | Julian | 84 | Robert | |||
| 35 | Aaron | Yes | 85 | Adrian | ||
| 36 | Wyatt | 86 | Kevin | |||
| 37 | Hunter | 87 | Cameron | Yes | ||
| 38 | Zachary | 88 | Thomas | |||
| 39 | Charles | Yes | 89 | Austin | ||
| 40 | Eli | 90 | Chase | |||
| 41 | Henry | 91 | Sebastian | Yes | ||
| 42 | Jason | 92 | Levi | |||
| 43 | Xavier | Yes | 93 | Ian | ||
| 44 | Colton | 94 | Dominic | |||
| 45 | Juan | 95 | Cooper | Yes | ||
| 46 | Josiah | 96 | Luis | |||
| 47 | Ayden | Yes | 97 | Carson | ||
| 48 | Adam | 98 | Nathaniel | |||
| 49 | Brody | 99 | Tristan | Yes | ||
| 50 | Diego | 100 | Parker | |||
| Lists of popular baby names can be great resources for researchers. To create this table, the list of top 100 names for boys based on Social Security Administration statistics was used. These lists are also great for coming up with pseudonyms for field research subjects and interview participants. See Family Education. (n.d.). Name lab. Retrieved from http://baby-names.familyeducation.com/popular-names/boys. | ||||||
There is one clear instance in which systematic sampling should not be employed. If your sampling frame has any pattern to it, you could inadvertently introduce bias into your sample by using a systemic sampling strategy. (Bias will be discussed in more depth in the next section.) This is sometimes referred to as the problem of periodicity. Periodicity refers to the tendency for a pattern to occur at regular intervals. Let’s say, for example, that you wanted to observe campus binge drinking on different days of the week. Perhaps you need to have your observations completed within 28 days and you wish to conduct four observations on randomly chosen days. Table 10.3 shows a list of the population elements for this example. To determine which days we’ll conduct our observations, we’ll need to determine our selection interval. As you’ll recall from the preceding paragraphs, we find our selection interval by dividing our population size (28-day period) by our desired sample size (4 observation days). This formula leads us to a selection interval of 7. If we randomly select 2 as our starting point and select every seventh day after that, we’ll wind up with a total of 4 days on which to conduct our observations. You’ll see how that works out in the following table.
| Day # | Day | Drinking | Observe? | Day # | Day | Drinking | Observe? | |
| 1 | Monday | Low | 15 | Monday | Low | |||
| 2 | Tuesday | Low | Yes | 16 | Tuesday | Low | Yes | |
| 3 | Wednesday | Low | 17 | Wednesday | Low | |||
| 4 | Thursday | High | 18 | Thursday | High | |||
| 5 | Friday | High | 19 | Friday | High | |||
| 6 | Saturday | High | 20 | Saturday | High | |||
| 7 | Sunday | Low | 21 | Sunday | Low | |||
| 8 | Monday | Low | 22 | Monday | Low | |||
| 9 | Tuesday | Low | Yes | 23 | Tuesday | Low | Yes | |
| 10 | Wednesday | Low | 24 | Wednesday | Low | |||
| 11 | Thursday | High | 25 | Thursday | High | |||
| 12 | Friday | High | 26 | Friday | High | |||
| 13 | Saturday | High | 27 | Saturday | High | |||
| 14 | Sunday | Low | 28 | Sunday | Low |
Do you notice any problems with our selection of observation days in Table 1? Apparently, we’ll only be observing on Tuesdays. Moreover, Tuesdays may not be an ideal day to observe binge drinking behavior! What might differ between days of the week that might also influence what we can record for our study?
In cases such as this, where the sampling frame is cyclical, it would be better to use a stratified sampling technique. In stratified sampling, a researcher will divide the study population into relevant subgroups (called strata) and then draw a sample from each subgroup. In this example, we might wish to first divide our sampling frame into two lists: weekend days and weekdays. Once we have our two lists, we can then apply either simple random or systematic sampling techniques to each subgroup.
Stratified sampling is a good technique to use when a subgroup of interest makes up a relatively small proportion of the overall sample, like in our previous example. In our example study of binge drinking, we want to include both weekdays and weekends in our sample. Since weekends make up less than a third of an entire week, there’s a chance that a simple random or systematic strategy would not yield sufficient weekend observation days. As you might imagine, stratified sampling is even more useful in cases where a subgroup makes up an even smaller proportion of the sampling frame—for example, students who are in their fifth year of their undergraduate program make up only a small percentage of the population of undergraduate students. While using a simple random or systematic sampling strategy may not yield any fifth-year students, utilization of stratified sampling methods would ensure that our sample contained the proportion of fifth-year students that is reflective of the larger population. In this case, class year (e.g., freshman, sophomore, junior, senior, and fifth-year) is our strata, or the characteristic by which the sample is divided. When we use stratified sampling, we are concerned with how well our sample reflects the population. A sample with too many freshmen may skew our results in one direction because perhaps they binge drink more (or less) than students in other class years. Using stratified sampling allows us to make sure our sample has the same proportion of people from each class year as the overall population of the school.
Up to this point in our discussion of probability samples, we’ve assumed that researchers will be able to access a list of population elements in order to create a sampling frame. As you might imagine, this is not always the case. Let’s say that you want to conduct a study of binge drinking across fraternity members at each undergraduate program in your state. Imagine how difficult it would be to create a list of every single fraternity member in the state. Even if you could find a way to generate such a list, attempting to do so might not be the most practical use of your time or resources. When this is the case, researchers turn to cluster sampling. A researcher using the cluster sampling method will begin by sampling groups (or clusters) of population elements and then selecting elements from within those groups.
Let’s work through how we might use cluster sampling in our study of binge drinking. While creating a list of all fraternity members in your state would be next to impossible, you could easily create a list of all undergraduate colleges in your state. Thus, you could draw a random sample of undergraduate colleges (your cluster) and then draw another random sample of elements (in this case, fraternity members) from within the undergraduate college you initially selected. Cluster sampling works in stages. In this example, we sampled in two stages— (1) undergraduate colleges and (2) fraternity members at the undergraduate colleges we selected. However, we could add another stage if it made sense to do so. We could randomly select (1) undergraduate colleges (2) specific fraternities at each school and (3) individual fraternity members. It is worthwhile to note that each stage is subject to its own sample error, so choosing to sampling in multiple stages could yield greater error. Nevertheless, cluster sampling is a highly efficient method.
Jessica Holt and Wayne Gillespie (2008) [2] used cluster sampling in their study of students’ experiences with violence in intimate relationships. Specifically, the researchers randomly selected 14 classes on their campus and then drew a random subsample of students from those classes. You probably know that college classes are different sizes. If the researchers had simply selected 14 classes at random and selected the same number of students from each class to complete their survey, then students in the smaller classes would have had a greater chance of being selected for the study than students in larger classes. Keep in mind, the goal of random sampling is to ensure that each element has the same chance of being selected. When clusters are different sizes, as in the previous example, researchers often use a method called probability proportionate to size (PPS). This means that they account for the different sizes of their clusters by giving the clusters different chances of being selected based on their size so that each element within those clusters has equal chance of being selected.
To summarize, probability samples allow a researcher to make conclusions about larger groups. Probability samples require a sampling frame from which elements, usually human beings, can be selected at random from a list. Even though random selection has less error and bias then nonprobability samples, some error will always remain. If researchers utilize a random number table or generator, then they can accurately state that their sample represents the population from which it was drawn. This strength is common to all probability sampling approaches summarized in Table 10.4.
| Sample type | Description |
| Simple random | Researcher randomly selects elements from sampling frame. |
| Systematic | Researcher selects every kth element from sampling frame. |
| Stratified | Researcher creates subgroups then randomly selects elements from each subgroup. |
| Cluster | Researcher randomly selects clusters then randomly selects elements from selected clusters. |
In determining which probability sampling approach makes the most sense for your project, it helps to have a strong understanding of your population. Simple random samples and systematic samples are relatively easy to carry out because they both require a list all elements in your sampling frame, but systematic sampling is slightly easier because it does not require you to use a random number generator. Instead, you can use a sampling interval that is simple to calculate by hand.
The relative simplicity of both approaches is counterweighted by their lack of sensitivity to the characteristics of your study’s target population. Stratified samples can better account for periodicity by creating strata that reduce or eliminate the effects of periodicity. Stratified samples also ensure that smaller subgroups are included in your sample, thus making your sample more representative of the overall population. While these benefits are important, creating strata for this purpose requires knowing information about your population before beginning the sampling process. In our binge drinking example, we would need to know how many students are in each class year to make sure our sample contained the same proportions. For example, we would need to know that fifth-year students make up 5% of the student population to ensure that 5% of our sample is comprised of fifth-year students. If the true population parameters are unknown, stratified sampling becomes significantly more challenging.
Each of the previous probability sampling approaches requires using a real list of all elements in your sampling frame. However, cluster sampling is different because it allows a researcher to perform probability sampling when a list of elements is not available or pragmatic to create. Cluster sampling is also useful for making claims about a larger population, like all fraternity members in a state. However, there is a greater chance of sampling error, as sampling occurs at multiple stages in the process, like at the university level and student level. For many researchers, this weakness is outweighed by the benefits of cluster sampling.
Weighting
Weighting is a statistical technique by which different individuals in a study are assigned varying weights for their responses based on that person’s characteristics. Through weighting, we can take samples that are not representative in themselves, and adjust them – or at least adjust the statistics from them – so that they do match the population of interest at least on the characteristics that we deem important, such as sex, race, ethnicity, education, and location. Weights are complicated and they’re not fun to use, because they really slow down calculations, but they are useful when you want a representative sample but the characteristics are off in a way that is quantifiable. A key here is that you must know how it’s off (you must be able to identify the sampling bias, which we’ll discuss later), and you need to know the make-up of the population of interest (otherwise you don’t know what you match your sample to). It’s unlikely you’d need to use weights yourself, but if you see a study that describes their data this way, you should understand that it means they are using mathematical adjustments to increase the generalizability of the results.
References
Neuman, W. L. (2007). Basics of social research: Qualitative and quantitative approaches (2nd ed.). Boston, MA: Pearson. ↵
Kogan, S. M., Wejnert, C., Chen, Y., Brody, G. H., & Slater, L. M. (2011). Respondent-driven sampling with hard-to-reach emerging adults: An introduction and case study with rural African Americans. Journal of Adolescent Research, 26, 30–60. ↵
Figure 10.2 copied from Blackstone, A. (2012) Principles of sociological inquiry: Qualitative and quantitative methods. Saylor Foundation. Retrieved from: https://saylordotorg.github.io/text_principles-of-sociological-inquiry-qualitative-and-quantitative-methods/ Shared under CC-BY-NC-SA 3.0 License (https://creativecommons.org/licenses/by-nc-sa/3.0/) ↵
Holt, J. L., & Gillespie, W. (2008). Intergenerational transmission of violence, threatened egoism, and reciprocity: A test of multiple psychosocial factors affecting intimate partner violence. American Journal of Criminal Justice, 33, 252–266. ↵
Image attributions
crowd men women by DasWortgewand CC-0
roll the dice by 955169 CC-0
