10 Textbook Simulations, Figures, and Coding Guide
u1273832
Textbook Simulations, Figures, and Coding Guide
Purpose: to help any future research assistant: code figures, code simulations, construct videos of simulations, and edit the textbook
Outline:
- – Getting started : Things needed to download, set up before coding
- o Ensure they use MATLAB Online for accurate representation for the end-user experience
- o How to use the GitHub and streamline/save progress
- o Where do all the files go?
- – General guidelines on creating apps
- – General guidelines/principles for creating simulations
- – How to turn a simulation into a movie download
TODO: make all headings h2 instead of h1 (for linking)
Table of Contents
FINISH
Introduction
The purpose of this document is to help create and add simulations, figures, and videos for the Electromagnetics: How it Works and Why it Matters. Each section will provide you with essential information and instructions on how to help with this project.
Initial Setup: GitHub and MATLAB workflow
GitHub is a website that allows users to store, share, and edit code files in a code base. You will need a GitHub account to work on this project.
- Go to GitHub and create an account.
- Request access to the “ElectromagneticsTextbookCode” Repository. For Dr. Furse to invite you, she can use these instructions:
- o Select “Settings” at the top of the repository page
- o Select “Collaborators” on the left side of the page
- o Select “Add people”
You now have access to the related files for the project.
You will see a way to add files to the repository, however there is a much more streamlined way for you to provide changes to the GitHub repository. Throughout the project, you will want to make sure your repository is up to date and well organized. Since most of the users will be accessing the book and MATLAB apps through MATLAB Online, I used the MATLAB Online environment to code. From MATLAB Online, you can change the repository code without having to visit the GitHub repository page. You will first need a “token” to access the repository.
- Select your profile picture on the top right corner of the GitHub page
- Select “Settings”
- Scroll down and select “Developer settings”
- Select “Personal access tokens”
- Select “Tokens (classic)
- Select “Generate new token (classic)”
- Create a description. I put “MATLAB Online GitHub access”
- Select an expiration date
- Select the checkbox for “repo”
- Scroll down and Generate token
- Copy the token and put it in a place you can easily access.
Now back in MATLAB Online, here are the instructions on how to change the code in the repository so it is always up to date. The basic workflow is to: edit (or replace) the file in question, commit the change, and then push the change.
- Clone the repository. Copy ” !git clone https://github.com/carsen311/ElectromagneticsTextbookCode.git ” into the command window in MATLAB. This will clone the repository and put it into your MATLAB drive.
- Edit or replace the file you are working on. This could be an image file (than an app uses for example), a .mlapp, .m or any other MATLAB file.
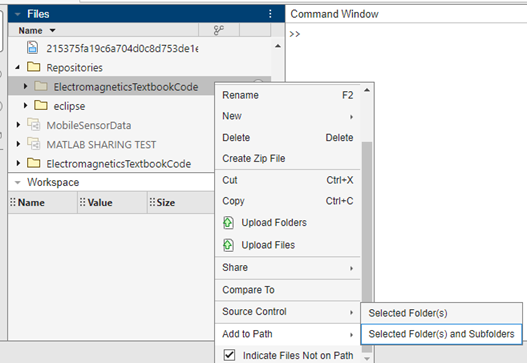
- Right-click the file.
- Select “Add to source control” under “Source Control” if the symbol next to the file is a black circle (INSERT IMAGE). This happens for new files. You do not need to do this if the file has a blue square next to it.
- Select “Commit” which is under “Source Control”.
- Document the changes you make.
- Right-click the file again and select “Push” which is also under “Source Control”. This will change the GitHub repository.
Note that if you delete a file in the cloned repository, it will also delete that file in the GitHub repository provided that you commit and push the change.
Accessing the textbook environment
Throughout the project, you may be asked to add simulations or perhaps write very small descriptive sections for your simulations in the textbook.
We are using “Pressbooks” to create our online textbook.
Request an invite from Professor Furse to work on the book. She will need to add you as administrator in order for you to edit the book.
Here is a link to our textbook. You will need to sign in.
Select “Sign in” on the top right corner of the screen.
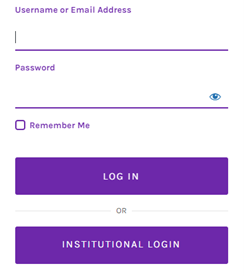
Select “Institutional Login” and sign in using your uID.
Select “admin” on the textbook homepage to be able to edit the book.
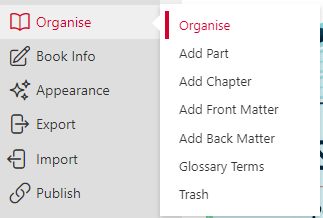
Select “Organise” shown above.
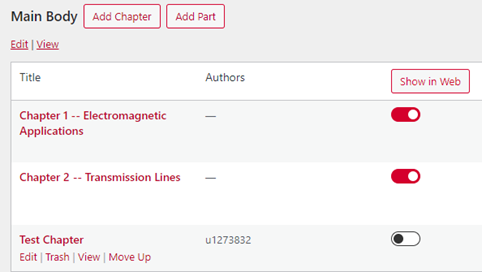
Hover your mouse over a specific chapter to be able to see the “Edit” option.
Select edit if you wish to make changes to that section of the book.
Creating a simulation with MATLAB App Designer
MathWorks has provided an easy-to-use tool to create interactive apps through its “App Designer”.
You will first need to learn the basics of App Designer.
It is well worth spending some time using the MathWorks Onramp course for the App Designer which can be found here:
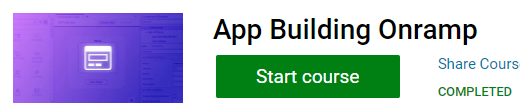
Make sure you are signed in to save progress and to save your certificate at the end.
You may also choose to examine other .mlapp files already in the repository.
Principles of simulation development
Some apps you may design will be so simple that they can essentially be created immediately without much planning for forethought. However, if your desired application is complex in any way, planning and designing your application will create a smooth development.
- Plan your application
- Understand the purpose of your application. What are your trying to demonstrate? What do you want the user to gain from using your application?
- Formulate essential features. What does it need to show? What does it need to allow the user to customize?
- Design your application
- Outline, draw, and/or design the application (in design view in MATLAB App Designer).
- Outline a model for your application. What kind of data are we analyzing? What data structure is best for manipulation or accessibility? What properties should your app have?
- Outline how all the components should interact. What should this button affect? What should this slider do to the other components?
- Implement necessary properties in the “properties” section of your app.
- Code and test your application
- Code what happens when the application opens in a startupFcn
- Code one feature/callback at a time and test teach feature.
- Test all features as you add more features. This ensures that your new callbacks don’t have unintended consequences on other callbacks.
- Keep edge cases in mind. What are all the ways a user could interact with your application? Can your application handle these edge cases?
- Validate your application
- Show the application to any necessary stakeholders to ensure the app runs as intended.
- Gather feedback and implement changes.
Optimizing simulation performance
If your simulation requires dynamically changing figures, here a few things to consider that will affect the performance:
- “drawnow” is a very demanding function in MALTAB. Consider calling it less frequently. You may do something like using the “mod” function in MATLAB to reduce the amount of graphics updates your simulation will call. Ensure that the actual data of your simulation updates, though.
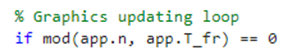
o In the example above, “app.n” is the counter for the simulation’s overall “while” loop. “app.T_fr” is the number of times the overall “while” loop will run until the graphics updating loop will actually run. In other words, every simulation will update both the data and the graphics—both sections of code within the simulation’s “while” loop. Every time MATLAB approaches this “if” statement, it checks to see if it has been “app.T_fr” times since the last graphics update. Typical T_fr times are between 2-4. After that, your simulation may begin to look choppy.
- You can make the updating graphics in your simulation appear smoother by calling “drawnow limitrate” instead of “drawnow”. FINISH
- At times, you may not know what is slowing down your app or simulation. MATLAB has a profiling feature that allows you to see what functions or sections of your code is taking up the most time. This only works on a native MATLAB environment, not MATLAB Online.
- o Enter “profile on” in the command line
- o Run the code
- o Enter “profile off” in the command line when done
- o Enter “profile viewer” in the command line to see the efficiency of your code.
Other notes on app building
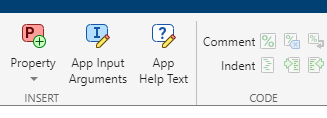
- Sometimes you will want some code to run before your user can interact with the app. You can use a startup function to do so:
- o Select “Code view”
- o Navigate to the right side to create a startup function:
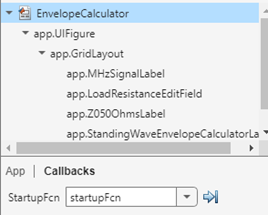
o You will need to make sure that you have selected your app and no other part of your app.
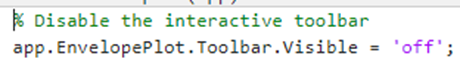
- If you need to remove the toolbar in your figure to allow for users to select values otherwise hidden by the toolbar, you can do so in the startup function.
- Below you see that a user cannot select a value on the graph hidden by the toolbar
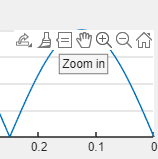
- Code the following line that corresponds to the figure you wish for the toolbar to be hidden.
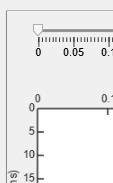
- If you want components in your UI to align better than what the “grid layout” can offer, consider using a “panel”
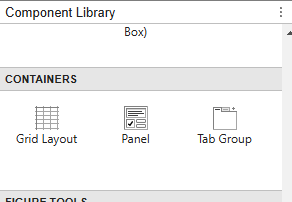
In this example, I want the slider to align with the x-axis of the graph below it. The grid layout does not allow that:
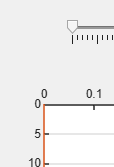
Whereas inserting a panel does:
Event Interrupting Error
Some components include a type of callback called “ValueChangingFcn”. These are great for creating a real-time interactivity, but often you will want to prevent event overlapping. Simply set the component’s “Interruptible” property to “off”.
In the below example, I kept getting artifacts in my graph. I tracked the issue down to the time slider’s value changing callback. The callback has two display statements to indicate that the callback function has been started and finished. Notice how the callback interrupts itself where you see “Function started” twice in a row. Variables get desynced, and the app ends up with a new_idx value less than the t_des_idx value within a conditional statement that should prevent otherwise. This ultimately caused the visual bug.
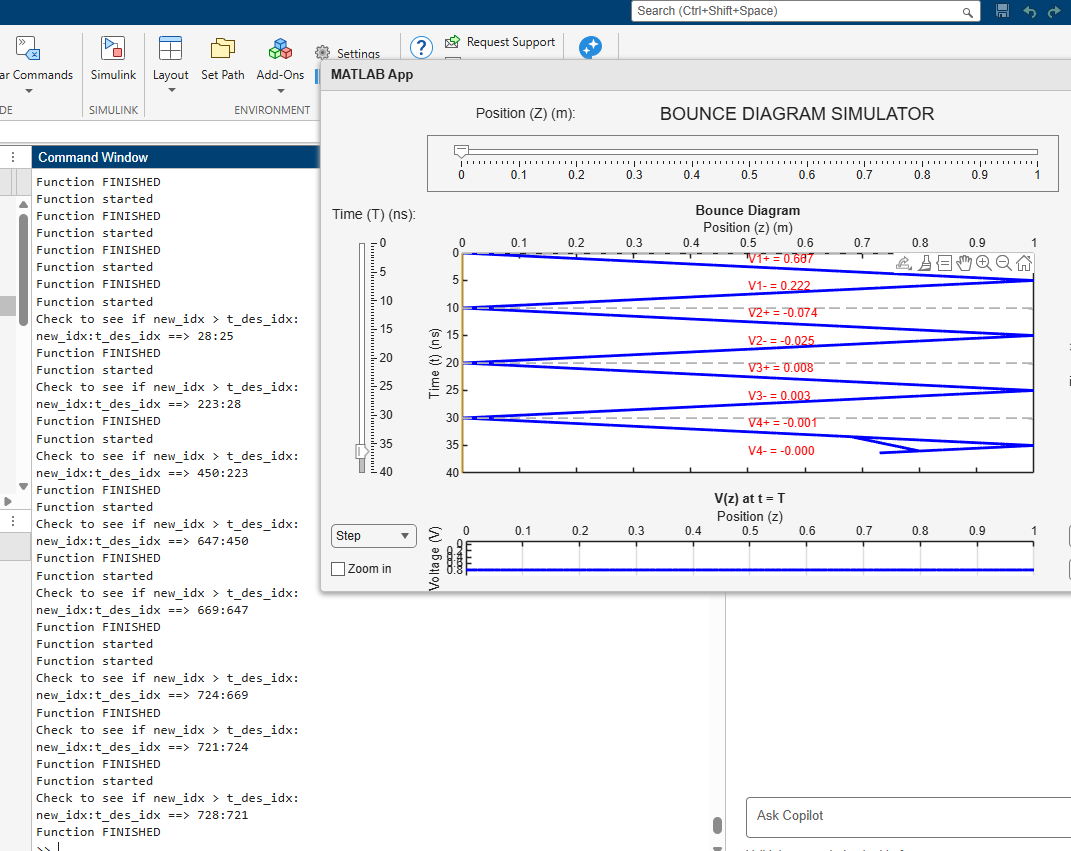
The problem was easily solved by adding this line of code to the startupFcn:
![]()
How to turn your simulation into a movie
Every simulation should have a video version. Videos are easy to embed into our textbook and do not require the user to leave the webpage. Keep in mind that your videos have a limit in size: 24 MB. One of the best file formats you should use is .mp4. Ask Professor Furse about the desired length of the video if you need guidance.
Capturing frames and creating a movie of your simulation can be an intensive process for your computer. Consider using a more powerful on-campus computer or letting this code run in the background while you work on other things. See the next section for more information.
First, you will need to make sure your figure or app has the appropriate size or dimensions. In the MATLAB app designer, you can adjust your app’s dimensions if you select your UI Figure under Component browser. Then select “Position” to adjust. Since your video will also be used during lectures, aim for 1280 by 720 resolution.
First, you will need to create a video object that will store information on your video capture. Below you see a video object created with constructor “VideoWriter” with the name of the file first and the file format second. Again, “MPEG-4” is one of the best formats you can use. Remember to be specific when naming your file.
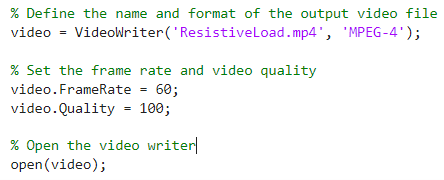
You can adjust your video’s framerate and quality seen above. Feel free to adjust this to help save storage. Next, you will need to open your video object in order to write frames to the video.
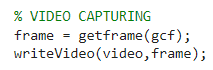
With whatever for-loop or while-loop you use to run your simulation, you will want to add the following code. “getframe” will capture an image of what your figure looks like in that moment. “gcf” means “get current figure” meaning “getframe(gcf) will capture a frame from the figure that is open at that moment.
If you are video capturing a MATLAB App, you will want to put the UIFigure object as the parameter: “getframe(app.UIFigure)” for example if you wish to capture your entire app.
To the number of frames you need for your video, simply compute (FrameRate) x (Desired Duration in Seconds). This will be the number of times you need to capture a frame. Test your video with a small number of frames to get a feel for how fast your simulation looks on video. you may need to increase or decrease framerate, or simply capture frames of your simulation less often (over other simulation update) or experiment with the time steps.
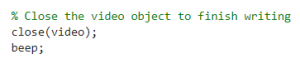
At the end of capturing, you will want to close your video object. It may be useful to add the “beep” command afterward. If you are running the video capture in the background while you do other things, it is a nice way to notify you that your video capture is complete.
Ensure your video file, which is saved in the current MATLAB path, is less than 24 MB. You may consider decreasing the framerate or video quality or splicing your final video.
Movie creation using a remote desktop
If you want to offload computing power while creating your movie, you may consider using a remote desktop.
Visit https://www.cade.utah.edu/remote-desktop-access/ for more information.
To easily transfer MATLAB files to the remote desktop, you may consider using UBox (campus cloud storage service) Visit https://box.utah.edu/ for access and more information.
Movie Compression
Pressbooks only allows files up to 24MB in size. You will also need to ensure your videos are high-quality for PowerPoint presentation. The solution is to run your simulation to produce a high quality video (high frame rate, resolution and quality) and use a tool to compress the video beneath 24MB for this textbook.
VLC medial player has tools to compress videos, although you may also explore the free tool HandBrake.
Whatever tool you use, you can use the formula: Bitrate (kbps) = (Target File Size (MB) x 8000) / (Duration (seconds)).
You may need to slightly lower the Bitrate (maybe by 200) to achieve a file size beneath 24 MB. Also remember to ensure that your final video file has minimal or non-existent audio data if unnecessary.
I highly recommend using HandBrake. VLC gave me problems. Ensure the codec you use will work with pressbooks: your best bet is to use H.264.
How to link your apps in the textbook
As of Fall 2024, MathWorks does not allow iFrame embedding due to security issues. It may be worth checking on that later. For now, you must provide the user with the link to access your simulations.
- Use this tool to link your simulations from the GitHub repository.
- Fill out all the necessary information for the related simulation.
- Select “Open in Focused View” for simulations.
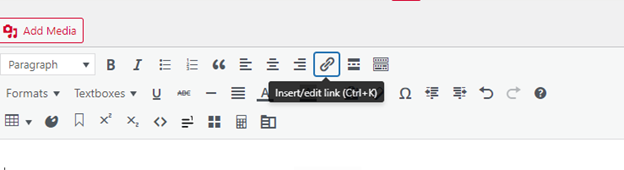
Now that you have the link to your simulation, you can link it in the textbook editor.
Accessing simulations through a GitHub link: downloading the repository
When a user selects a link, they will be brought to MATLAB Online on their browser to access the GitHub file. Ensure you are signed into MATLAB using your university account for full access. All other users who do not have a MATLAB license can still use a free version of MATLAB Online.
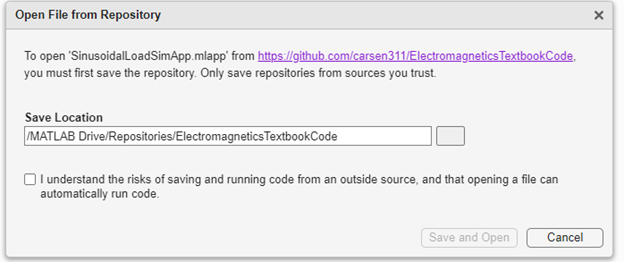
The above prompt will ask you to save the entire repository in a folder in your MATLAB Online Drive. It will not be saved onto your computer.
Note that your MATLAB Online Drive will not update if you push changes to the original file on the GitHub repository. You are saving a particular version of the GitHub repository. In this instant.
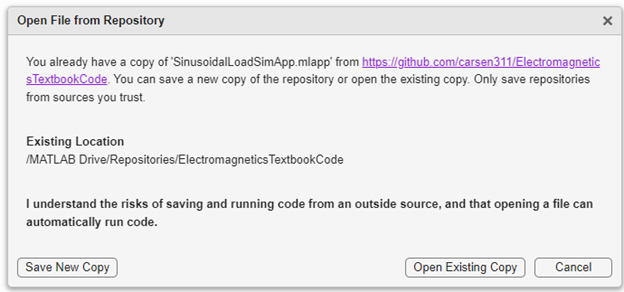
Any future times that you or the user accesses a link for the same repository will give you the above prompt. If you have since made changes to the repository and want to verify its functionality, make sure you either save a new copy or delete the original repository folder in your MATLAB Drive and save a new repository.
Accessing simulations through a GitHub link: check file path
As of October 2024, MathWorks has a bug that does not properly set up the MATLAB Online file path when you access a simulation through a GitHub link in Focused View.
When you first access a simulation, check to see if it is responsive. If it’s not, select “Show Desktop” on the upper right corner of the screen.

Add the repository folder to the MATLAB path
To return to the Focused View of the simulation, select the expand button on the simulation window.
Copyright and Citations FINISH
ADD: Information on finding creative commons images and figures to add to apps.
You are likely to need other people’s work for you to efficiently create good simulations and apps. Therefore, it is important you always cite other people’s work in your apps.
This project is also an open-source project, so each app will need to show that.
To add copyright information to your app, first select “App Help Text” while in “Code View” in your app designer.
Copy, paste, and edit the following copyright attribution:
CC BY-SA (Attribution Sharealike) YOUR NAME 2024
Written by YOUR NAME (YOUR EMAIL) for Cynthia Furse (cynthia.furse@utah.edu)
University of Utah Electrical and Computer Engineering
If you used a snippet of another person’s code, make sure it’s cited properly in the code itself
Creating Stills – Capturing
Creating stills will often depend on resolution requirements and what information you’re trying to convey. Often you will create stills after creating the base application. This can be easily done by using the windows keyboard shortcut:
⊞ Win + SHIFT + S.
You may need to recreate the app to better suit the still or figure you are creating. In this case, create a copy of the application and rename to “[app name] still creation” or something similar. This should be uploaded to the Github repository so teachers can create their own figures if need be.
There may also be times when resolution is important. Note that screenshotting your application will limit its resolution to your monitor’s resolution. One simple fix is to use a larger monitor or a TV and use the screenshot function. Another is to use the MATLAB functions exportgraphics for individual graphics objects like UIAxes or getframe for the UIFigure. For exportgraphics, pay attention to the resolution and for getframe you will still need to ensure the on-screen resolution is large enough.
Creating Stills – Editing
Many times you will need to annotate your screenshots for use in the textbook. Use PowerPoint to edit the figures. Some features you may find useful are:
- Eyedropper: If you need to use colors already present in the image, the eyedropper found in the “Shape Fill” or “Shape Outline” options can select colors in your image.
- TODO add more.
Alt text, captions, and figure descriptions
TODO finish here
How to link other chapters/sections:
You may, at times, want to link other portions of the textbook. Creating a link to a chapter’s page can be fine for linking general information, although sometimes a user may want to go straight to a particular section within a chapter. For example, you may click the following link to be taken to the Table of Contents of this chapter.
To create a successful link you must:
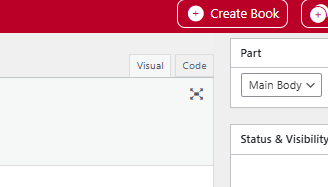
- Open the code view while you are editing a chapter. It is located on the top right next to “Visual”
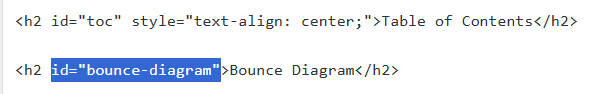
- Add an anchor to the section you are linking to. The anchor will have form id=”anchor-here”. Notice the use of kebab-case for anchors. Typically, this will be a heading, although anchors can be added to other elements like figures or paragraphs.
- Note that it is best practice for there to be one <h1> tag per page. In this case, you will only have “Heading 1” for each chapter. Everything must be “Heading 2” (or <h2>) or below.
- Create the link by copying the page’s chapter link and adding the anchor using “#”. For this textbook, the link should have the form: https://uen.pressbooks.pub/electromagnetics/chapter/chapter-name/#anchor-id
- If you are linking something in the appendix (like for long-descriptions) it should have the form: https://uen.pressbooks.pub/electromagnetics/back-matter/appendix/#anchor-id
- Test the link. Ensure that it takes you to exactly where you want.
- An example link for the bounce diagram example in the image above with anchor id=”bounce-diagram” will look like this: https://uen.pressbooks.pub/electromagnetics/chapter/all-about-bounce-diagrams/#bounce-diagram. This assumes chapter name “All About Bounce Diagrams” found in the Main body. This will take the user to a Heading 2 with anchor “bounce-diagram”.
- Add the link to the text “[Image Description]” in the caption of a figure or near the figure it’s describing.
- Add a return link to the text “[Return to reading]” for long-descriptions in Appendix-A.
Need help?
Remember that there are many people at the university ready to help. Reach out to your MathWorks consultants or Dr. Furse if you ever need help.
A good rule of thumb is that if you feel like your “wheels are spinning in place”, it’s time to reach out to someone.
If there is anything that you or Professor Furse cannot figure out, you are more than welcome to reach out to me. Especially if it relates to work I have done on the project. Here is my email:
If I do not respond soon, feel free to send another email or send a text:
(801)897-7816
Media Attributions
- Picture3
- Picture4
- Picture5
- Picture6
- Picture7
- Picture8
- Picture9
- Picture10
- PanelComponentLocation
- unalignedslider
- AlignedSlider
- BDSelfInterruptProblem
- InterruptibleOff
- Picture11
- Picture12
- CloseVideoBeep
- Picture13
- Picture14
- Picture15
- Picture16
- Picture17
- Picture18
- CodeViewPressbooks
- AnchorImageExample
