5 Example 2-2 Fourier Series App
Link to Focused View app:
Ω
APP THUMBNAIL:
IN TEXT DESCRIPTION:
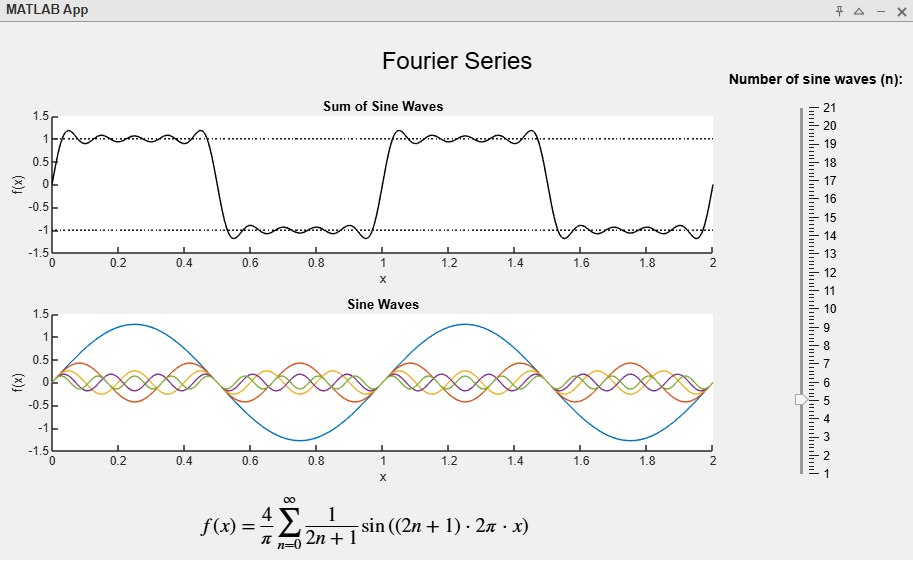
You can interact with the Fourier series application to get a better idea on how a square waveform can be composed of multiple sine waves through a Fourier Series equation. You can increase the number of terms in the Fourier series using the slider on the right. The bottom graph shows all the sine waves used in the series and the top graph shows the sum of those sine waves. You’ll notice that the more terms you add, the more the sum will appear as a square wave.
INSERT VIDEO
IN TEXT DESCRIPTION:
Notice in the below video that as the number of terms in the Fourier series increases, the sum of the sine waves approximate a square wave better and better. The rising and falling edges appear more vertical and the top and bottom portions appear less “wiggly”. You will notice that at the beginning and end of each rising and falling edge there is some inevitable overshoot. This is called “Gibbs phenomenon”. You can investigate Gibbs phenomenon more in the Fourier series application.
INSERT STILLS
IN TEXT DESCRIPTION:
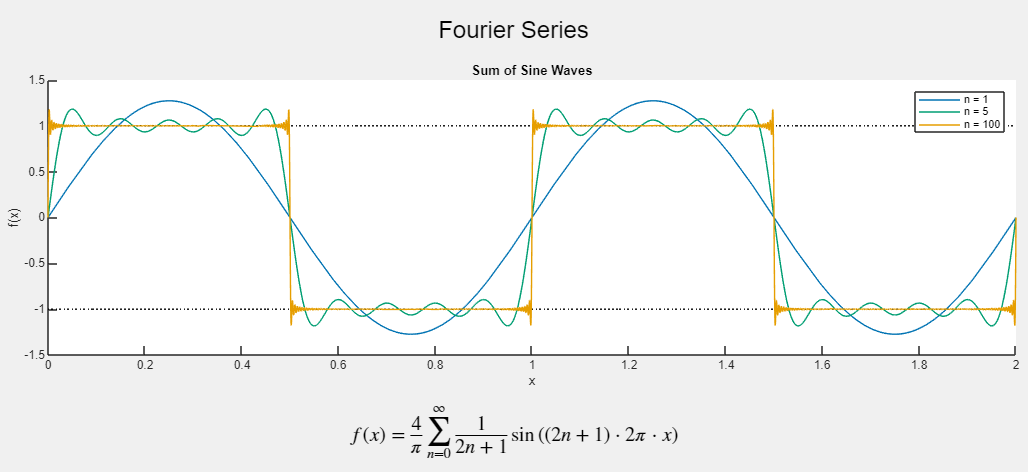
Figure [???] shows different Fourier series for different number of terms. Notice that 1 term is a simple sine wave. 5 terms approximates a square wave with some “wiggle” and slanted rising and falling edges. 100 terms has near vertical rising and falling edges as well as sticking to the 1 and -1 volt values rather well besides briefly at locations where Gibbs phenomenon takes effect. You can investigate further how the number of terms affects the shape of the square wave in the Fourier series app.
Media Attributions
- FourierAppThumbnail
- FourierSeriesStill
