11 Example 2-7 Smith Chart
APPLICATION – SMITH CHART BASIC
APPLICATION THUMBNAIL:
IN TEXT DESCRIPTION:
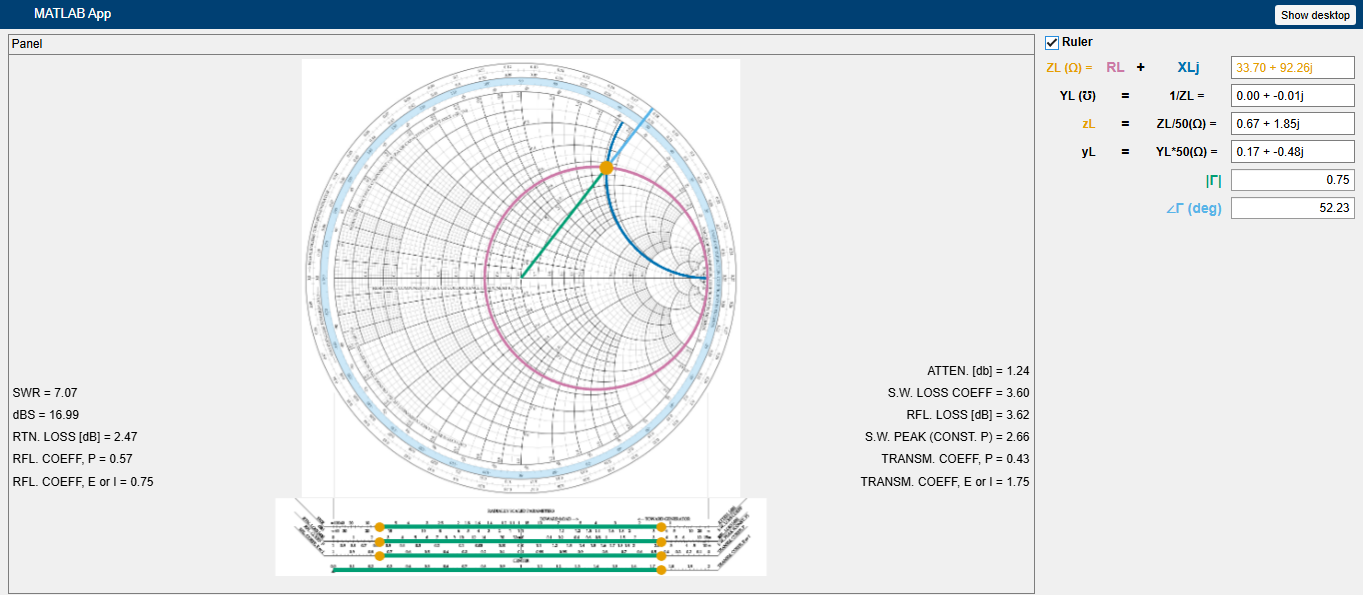
You can interact with the Smith chart basic app to understand its fundamentals. You may select anywhere on the chart to see the corresponding load impedance and admittance as well as their normalized values. You can also see the magnitude and angle of the reflection coefficient. These values can also be altered in their corresponding text boxes to analyze how other values change. There is also a selectable ruler on the app to read off other values.
SCREEN READER DESCRIPTION:
You can interact with the Smith chart basic app to understand its fundamentals. You may select anywhere on the chart in the center of the application to see the corresponding load impedance and admittance as well as their normalized values located on the top right corner of the app. You can also analyze the magnitude and angle of the reflection coefficient located in the same area. These values can also be altered in their corresponding text boxes to investigate how other values change. There is also a ruler checkbox for reading read off other values. The checkbox is located in the top right and above the text entries. When selected, a green line extends from the center of the Smith chart to the point designated on the chart. Equally sized green lines appear on the ruler beneath the Smith chart whose values are displayed to the left and right of the chart.
STILL
VIDEO – Increasing Imaginary component
video – increasing real component
APPLICATION…
Media Attributions
- SmithChartBasicAppThumbnail
