7 Example 2-4 Attenuation Simulation
Simulation link:
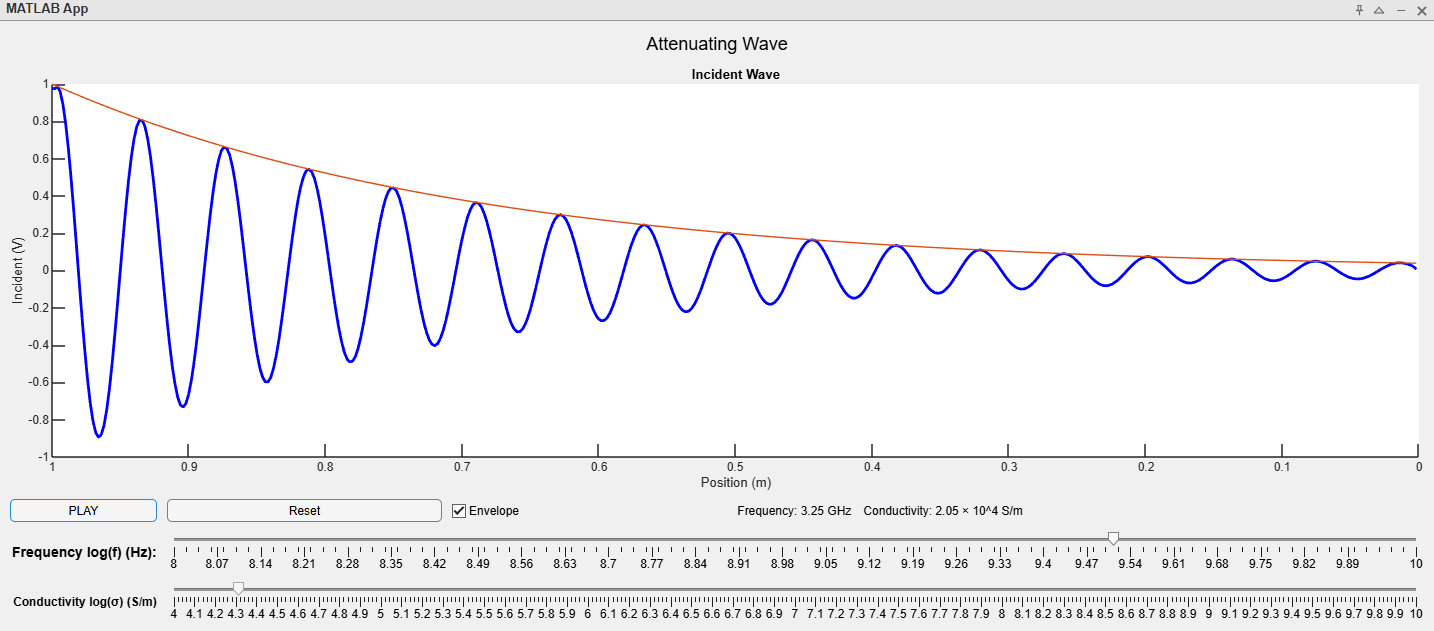
APPLICATION THUMBNAIL:
IN TEXT DESCRIPTION:
The attenuation simulation application below will allow you to see how adjusting a signal’s frequency and a transmission line’s conductivity will affect the signal’s attenuation. You may also see the signal’s envelope. The load is always matched in this application.
Stills:
IN TEXT DESCRIPTION:
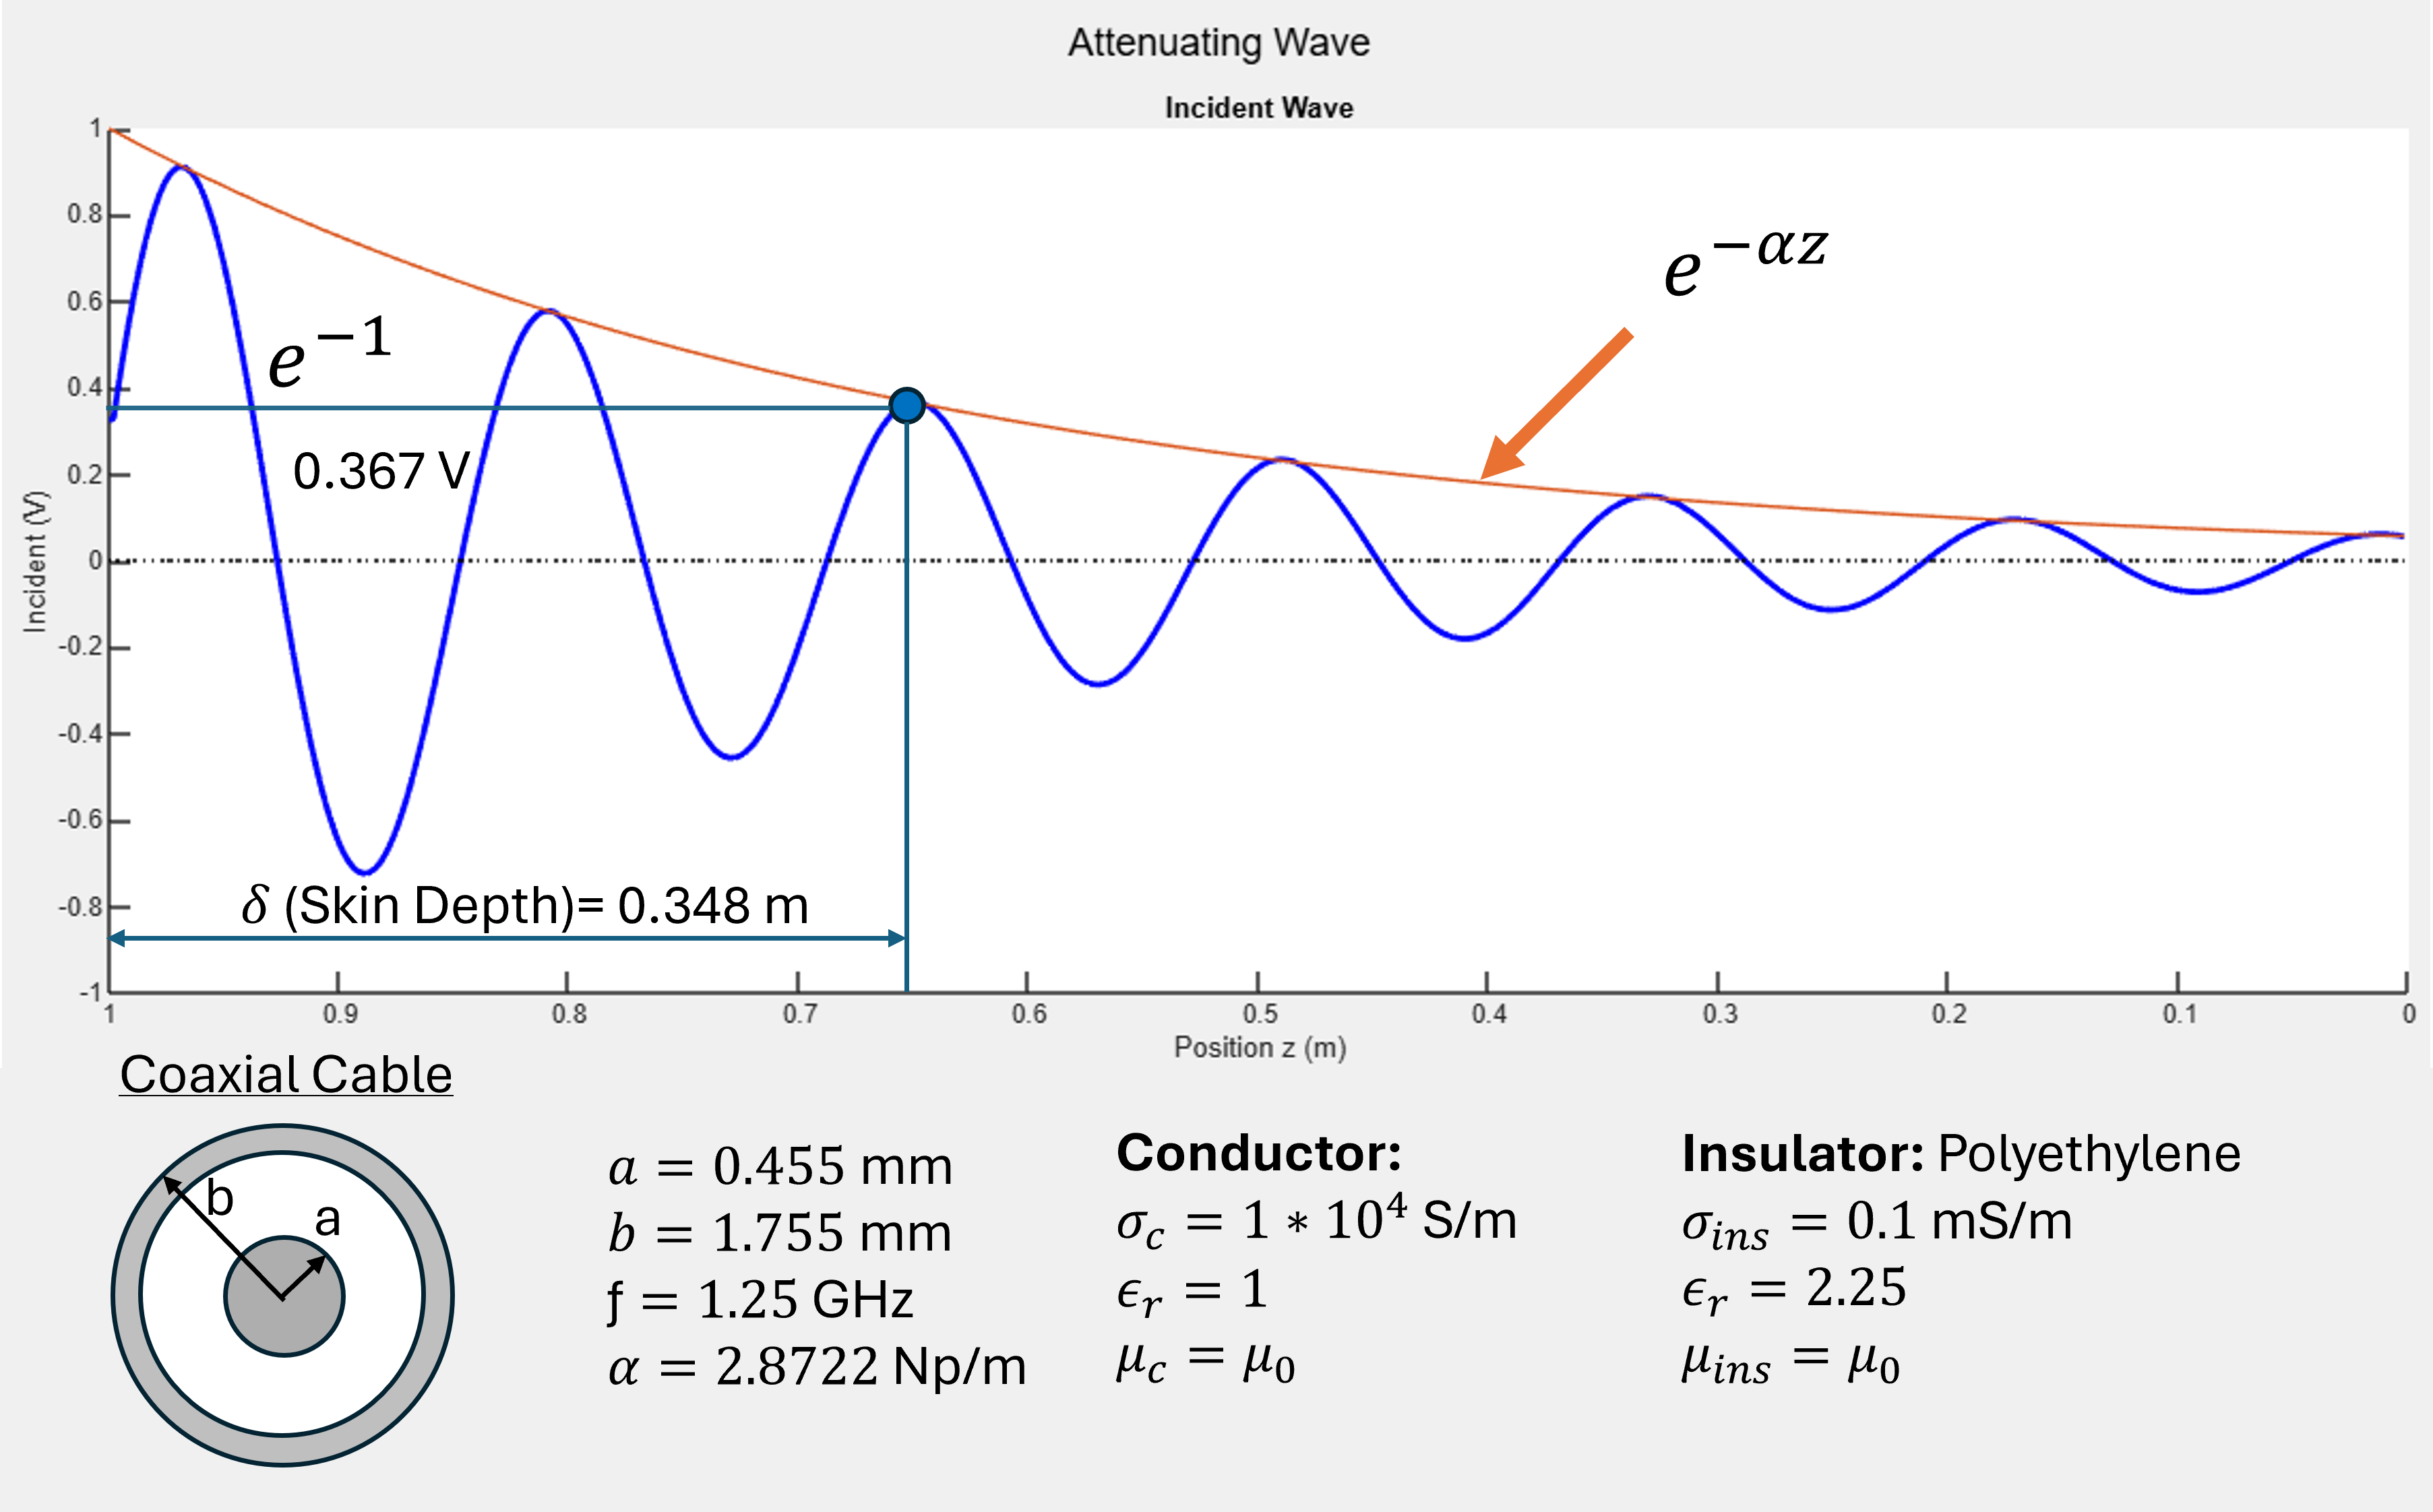
Figure [???] shows an attenuating wave for a 1 V amplitude sinusoidal signal. Notice the skin depth indicated as a blue dot as well as the equation for the envelope’s attenuation. See the attenuation simulation app to explore how conductivity and frequency affect the skin depth.
Videos:
IN TEXT DESCRIPTION:
Figure [???] shows the evolution of an attenuation wave for 1.25 GHz and conductivity 1*10^4 S/m. Notice that as the signal propagates, the peaks of the wave follow the envelope as described by equation [???]. See attenuation simulation app to investigate the envelope further.
Media Attributions
- AttenuatingWaveAppThumbnail
- Attenuating Wave Still
