Key Concepts in Quantitative Research
In this chapter, we are going to explore the nuances of quantitative research, including the main types of quantitative research, more exploration into variables (including confounding and extraneous variables), and causation.
Content includes:
- Understanding Variables
- Quantitative Research Design
- Reliability in Quantitative Research
- Validity in Quantitative Research
- Confounding and Extraneous Variables
- Causality
Objectives:
- Describe the differences between independent and dependent variables.
- Describe the steps in quantitative research methodology.
- Describe experimental, quasi-experimental, and non-experimental research studies.
- Describe confounding and extraneous variables.
- Differentiate cause-and-effect (causality) versus association and correlation.
Key Terms:
Blinding: A process in research where participants, researchers, or both are unaware of which group (control or experimental) participants belong to, to prevent bias in the results. Blinding can be single (participants unaware), double (both participants and researchers unaware), or triple (participants, researchers, and data analysts unaware).
Confounding Variable: An outside influence that changes the effect of a dependent and independent variable, leading to potential misinterpretation of the relationship between them. Confounding variables can bias results if not controlled or accounted for.
Control Variable: A variable that is kept constant or controlled throughout an experiment to ensure that it does not affect the outcome of the study. Control variables help isolate the relationship between the independent and dependent variables.
Descriptive Design: A study design that aims to describe characteristics of a population or phenomenon being studied. It does not answer questions about how/when/why the characteristics occurred, rather it addresses the “what” question.
Dependent Variable: The variable being tested and measured in an experiment. It is expected to change in response to changes in the independent variable.
Experimental Design: A study design that involves manipulating one variable (independent variable) to determine if changes in one variable cause changes in another (dependent variable). This design includes random assignment and control groups.
Extraneous Variable: Variables that are not of interest in a study but could affect the results. If not controlled, they can introduce error or bias.
Independent Variable: The variable that is changed or controlled in a scientific experiment to test the effects on the dependent variable.
Non-Experimental Design: A study design that lacks manipulation of the independent variable and random assignment, often used for observational studies, surveys, and correlational research.
Quasi-Experimental: A study design that resembles an experimental design but lacks random assignment. It is used when randomization is not feasible, yet still aims to determine causal relationships.
Random Assignment: The process of randomly allocating participants to different groups (e.g., experimental vs. control) in a study to ensure that each participant has an equal chance of being placed in any group. This helps to reduce bias and ensure the groups are comparable.
Random Sampling: A method of selecting a sample from a population in such a way that every individual has an equal chance of being chosen. This technique helps to ensure that the sample is representative of the population.
Reliability: The consistency and stability of the results obtained from a study or measuring instrument. A reliable study or instrument will yield the same results under consistent conditions.
Validity: The extent to which a test, instrument, or study accurately measures or reflects what it is intended to measure. Validity indicates how truthful the results of the study are.
Introduction
As an entry-level nursing student, your journey into evidence-based practice (EBP) will often lead you to encounter and engage with quantitative research. Quantitative research is a cornerstone of EBP, providing the numerical data and statistical analysis that underpin clinical decision-making and the development of best practices in healthcare. Understanding the fundamental concepts of quantitative research is essential for interpreting research findings, critically appraising studies, and applying evidence to improve patient outcomes. Having a strong command of quantitative literacy is necessary to fulfill nurses’ professional responsibilities across education levels, roles, and settings (Schroeder et al., 2022).
Quantitative research is characterized by its systematic approach to gathering and analyzing numerical data to answer specific research questions or test hypotheses (Heavy, 2019). It seeks to establish patterns, relationships, and cause-and-effect links between variables, often through large-scale studies that can be replicated and generalized to broader populations. Unlike qualitative research, which explores the depth and complexity of human experiences, quantitative research focuses on quantifying elements of these experiences to draw objective, measurable conclusions.
In this chapter, we will explore the foundational concepts of quantitative research, including variables, measurement, study design, sampling, and data analysis. We will also discuss the importance of reliability and validity in research, the different quantitative studies you may encounter, and the ethical considerations involved in conducting and applying quantitative research in nursing practice.
By the end of this chapter, you should have a solid understanding of how quantitative research contributes to the evidence base in nursing, empowering you to make informed decisions in your practice. You will learn how to critically evaluate the quality of quantitative research studies and apply their findings to provide high-quality, evidence-based care to your patients.
Flaws, Proof, and Rigor in Research
One of the biggest hurdles that students and seasoned researchers alike struggle to grasp, is that research cannot “prove” nor “disprove”. Research can only support a hypothesis with reasonable, statistically significant evidence.
Say what?
Indeed. You’ve heard it incorrectly your entire life. You will hear professors, scientists, radio ads, podcasts, and even researchers comment something to the effect of, “It has been proven that…” or “Research proves that…” or “Finally! There is proof that…”
We have been duped. Consider the “prove” word a very bad word in this course. The forbidden “P” word. Do not say it, write it, allude to it, or repeat it. And, for the love of avocados and all things fluffy, do not include the “P” word on your EBP poster. You will be deducted some major points.
We can only conclude with reasonable certainty through statistical analyses that there is a high probability that something did not happen by chance but instead happened due to the intervention that the researcher tested. Got that? We will come back to that concept but for now know that it is called “statistical significance”.
All research has flaws. We might not know what those flaws are, but we will be learning about confounding and extraneous variables later on in this module to help explain how flaws can happen.
Remember this: Sometimes, the researcher might not even know that there was a flaw that occurred. No research project is perfect. There is no 100% awesome. This is a major reason why it is so important to be able to duplicate a research project and obtain similar results. The more we can duplicate research with the same exact methodology and protocols, the more certainty we have in the results and we can start accounting for flaws that may have sneaked in.
Finally, not all research is equal. Some research is done very sloppily, and other research has a very high standard of rigor. How do we know which is which when reading an article? Well, within this module, we will start learning about some things to look for in a published research article to help determine rigor. We do not want lazy research to determine our actions as nurses, right? We want the strongest, most reliable, most valid, most rigorous research evidence possible so that we can take those results and embed them into patient care. Who wants shoddy evidence determining the actions we take with your grandmother’s heart surgery?
Understanding Variables
As we were already introduced to, there are measures called “variables” in research. This will be a bit of a review but it is important to bring up again, as it is a hallmark of quantitative research. In quantitative studies, the concepts being measured are called variables (AKA: something that varies). Variables are something that can change – either by manipulation or from something causing a change. In the article snapshots that we have looked at, researchers are trying to find causes for phenomena. Does a nursing intervention cause an improvement in patient outcomes? Does the cholesterol medication cause a decrease in cholesterol level? Does smoking cause cancer?
The presumed cause is called the independent variable. The presumed effect is called the dependent variable. The dependent variable is “dependent” on something causing it to change. The dependent variable is the outcome that a researcher is trying to understand, explain, or predict.
Think back to our PICO questions. You can think of the intervention (I) as the independent variable and the outcome (O) as the dependent variable.
Again, in quantitative research, variables are the elements that researchers measure, manipulate, or observe. These are the concepts that are being measured. They are the building blocks of research studies and are categorized into different types.
- Independent Variable (IV): The variable manipulated or controlled by the researcher to observe its effect on the dependent variable. For example, in a study examining the impact of a new drug on blood pressure, the drug is the independent variable.
- Dependent Variable (DV): The variable that is measured to assess the effect of the independent variable. In the same study on blood pressure, the blood pressure readings are the dependent variable.
For example, in a study examining the impact of nurse-led education on patient anxiety levels, the independent variable would be the education program, and the dependent variable would be the measured anxiety levels of the patients.
Variables can change – either by manipulation or from something causing a change (Gray & Grove, 2021). Researchers are trying to find causes for phenomena. Does a nursing intervention cause an improvement in patient outcomes? Does the cholesterol medication cause a decrease in cholesterol levels? Does smoking cause cancer?

Variables do not always measure cause-and-effect. This is extremely important to note! They can also measure a direction of influence.
Here is an example of that: If we compared levels of depression among men and women diagnosed with pancreatic cancer and found men to be more depressed, we cannot conclude that depression was caused by gender. However, we can note that the direction of influence clearly runs from gender to depression. It makes no sense to suggest the depression influenced their gender.
In the above example, what is the independent variable (IV) and what is the dependent variable (DV)? If you guessed gender as the IV and depression as the DV, you are correct! Important to note in this case that the researcher did not manipulate the IV, but the IV is manipulated on its own (male or female).
Researchers do not always have just one IV. In some cases, more than one IV may be measured. Take, for instance, a study that wants to measure the factors that influence one’s study habits. Independent variables of gender, sleep habits, and hours of work may be considered. Likewise, multiple DVs can be measured. For example, perhaps we want to measure weight and abdominal girth on a plant-based diet (IV).
Now, some studies do not have an intervention. We will come back to that when we talk about non-experimental research.
The point of variables is so that researchers have a very specific measurement that they seek to study.
![]() Knowledge to application link.
Knowledge to application link.
Let’s look at a couple of examples:
|
Study |
Independent Variable(s)(Intervention/Treatment) |
Dependent Variable(s)(Effect/Results) |
|
Case One: An analysis of emotional intelligence in nursing leaders—focuses on the meaning of emotional intelligence specific to nurses—defines emotional intelligence, the consequences, and antecedents. A literature review is used to find information about the meaning, consequences, and antecedents of emotional intelligence. |
None – there is no intervention |
The definition of emotional intelligence. The antecedents of emotional intelligence. |
|
Case Two: In this study, nurses use protocol hand hygiene for their own hands and patient hands to examine if the hand hygiene protocol will decrease hospital-acquired infections in the Intensive Care Unit. |
Hand hygiene for nurses and patients. Nurse in-service training on hand hygiene for nurses and patients. |
Hospital-acquired infection rates in the ICU. |
Now you try! Identify the IVs and DVs:
|
Study |
Independent Variable(s)(Intervention/Treatment) |
Dependent Variable(s)(Effect/Results) |
|
Case Three: A nurse wants to know if extra education about healthy lifestyles with a focus on increasing physical activity with adolescents will increase their physical activity levels and impact their heart rates and blood pressures over a 6-month time. Data is collected before intervention and after intervention at multiple intervals. A control group and intervention group is used. Randomized assignment to groups is used. (True Experimental design with intervention group, control group, and randomization.) |
|
|
|
Case Four: Playing classical music for college students was examined to study if it impacts their grades—music was played for college students in the study and their post music grades were compared to their pre-music grades. |
|
|
|
Case Five: A nurse researcher studies the lived experiences of registered nurses in their first year of nursing practice through a one-on-one interview. The nurse researcher records all the data and then has it transcribes to analysis themes that emerge from the 28 nurses interviewed. |
|
|
IV and DV Case Studies (Leibold, 2020)
Well done!
Answers:
Case Three: Independent variable: Healthy Lifestyle education with a focus on physical activity; Dependent variable: Physical activity rate before and after education intervention, Heart rate before and after education intervention, Blood pressures before and after education intervention.
Case Four: Independent variable: Playing classical music; Dependent variable: Grade point averages post classical music, compared to pre-classical music.
Case Five: Independent variable: No independent variable as there is no intervention. Dependent variable: The themes that emerge from the qualitative data.
![]() Hot Tip! Independent variables (IVs) are the “cause,” while dependent variables (DVs) are the “effect.” When evaluating research, always ask: What is being manipulated, and what is being measured?
Hot Tip! Independent variables (IVs) are the “cause,” while dependent variables (DVs) are the “effect.” When evaluating research, always ask: What is being manipulated, and what is being measured?
3. Confounding Variables: These are variables that the researcher may not be able to control but could influence the study’s outcome. For example, lifestyle factors like diet or stress could affect blood pressure readings. Confounding variables are extraneous variables that interfere with or influence the relationship between the independent and dependent variables. In research investigating a potential cause-and-effect relationship, a confounding variable is an unmeasured third variable that influences the supposed cause and effect.
It is essential to consider any potential confounding variables and account for them in research designs to ensure valid results. You can imagine that if something sneaks in to influence the measured variables, it can really muck up the study!
Here is an example of a confounding variable:
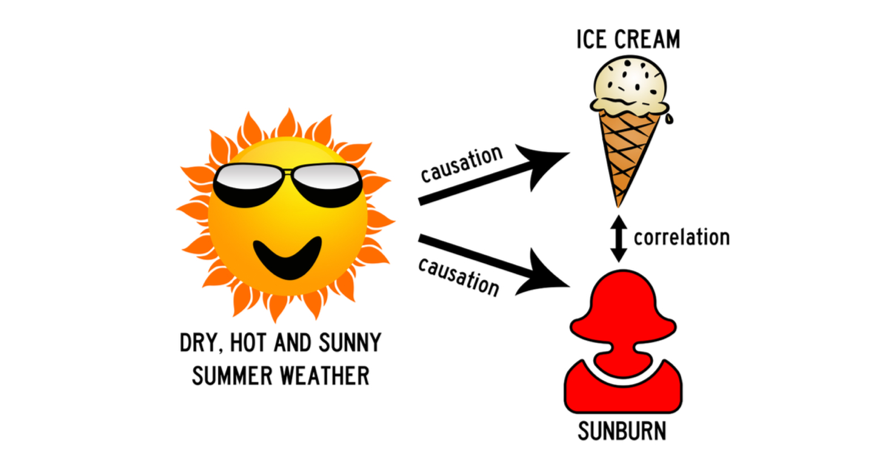
You collect data on sunburns and ice cream consumption. You discover that higher ice cream consumption is associated with a higher probability of sunburn. Does that mean ice cream consumption causes sunburn?
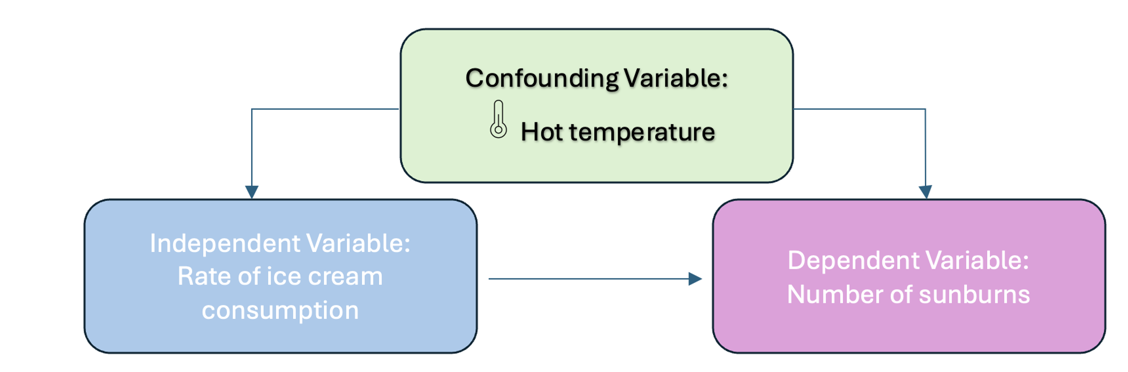
Figure Above: Conceptual Model with a Confounding Variable
Here, the confounding variable is temperature: hot temperatures cause people to both eat more ice cream and spend more time outdoors under the sun, resulting in more sunburns.
To ensure the internal validity of research, the researcher must account for confounding variables. If they fail to do so, the results may not reflect the relationship between the variables they are interested in.
For instance, they may find a cause-and-effect relationship that does not exist because the effect they measure is caused by the confounding variable (and not by the independent variable).
Here is another example:
The researcher finds that babies born to mothers who smoked during their pregnancies weigh significantly less than those born to non-smoking mothers. However, suppose the researcher does not account for the fact that smokers are more likely to engage in other unhealthy behaviors, such as drinking or eating less healthy foods. In that case, he/she might overestimate the relationship between smoking and low birth weight.
4. Extraneous Variables: These are any variables the researcher is not investigating that can potentially affect the outcomes of the research study. If left uncontrolled, extraneous variables can lead to inaccurate conclusions about the relationship between IVs and DVs.
Extraneous variables can threaten the internal validity of a study by providing alternative explanations for the results. In an experiment, the researcher manipulates an independent variable to study its effects on a dependent variable.
Here is an example:
In a study on intellectual performance, the researcher tests whether wearing a white lab coat, the independent variable (IV), improves scientific reasoning, the dependent variable (DV).
Students from a university are recruited to participate in the study. The researcher manipulates the independent variable by splitting participants into two groups:
- Participants in the experimental group were asked to wear lab coats during the study.
- Participants in the control group were asked to wear casual coats during the study.
All participants are given a scientific knowledge quiz, and their scores are compared between groups. When extraneous variables are uncontrolled, it’s hard to determine the exact effects of the independent variable on the dependent variable, because the effects of extraneous variables may mask them.
Uncontrolled extraneous variables can also make it seem as though there is a true effect of the independent variable in an experiment when there’s actually none.
In the above experiment example, these extraneous variables can affect the science knowledge scores:
- Participant’s major (e.g., STEM or humanities)
- Participant’s interest in science
- Demographic variables such as gender or educational background
- Time of day of testing
- Experiment environment or setting
If these variables systematically differ between the groups, you can’t be sure whether your results come from your independent variable manipulation or from the extraneous variables.
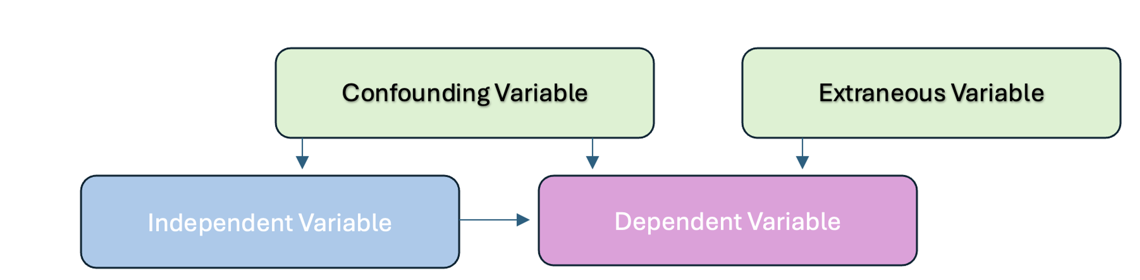
Figure above: Extraneous and Confounding Variables
5. Control Variables: These variables are kept constant to minimize their impact on the study’s outcome. By controlling for these variables, researchers can better isolate the effect of the independent variable on the dependent variable.
![]() Hot Tip! Watch out for confounding variables! These sneaky variables can distort study results! Researchers must control for factors like lifestyle, stress, or environment to ensure accurate findings. Always look for how studies address confounding variables.
Hot Tip! Watch out for confounding variables! These sneaky variables can distort study results! Researchers must control for factors like lifestyle, stress, or environment to ensure accurate findings. Always look for how studies address confounding variables.
Quantitative Research Design
Quantitative research design is the blueprint that guides how a study is conducted. The design of a quantitative study outlines the procedures for data collection, analysis, and interpretation, ensuring that the research is systematic and that the findings are valid and reliable. The choice of research design is critical because it determines the strength and quality of the evidence generated.
A quantitative research study can be done to describe variables. Quantitative research designs can also be done to determine the association of test and outcome variables (Bass & Maloy, 2020). Typically, quantitative studies involve collecting numerical data.
Key Elements of Research Design
- Purpose: The research design should align with the purpose of the study, whether it is to describe a phenomenon, examine relationships between variables, or test interventions.
- Structure: The structure of the design determines how the study is organized, including the selection of participants, the allocation of interventions, and the timing of data collection.
- Control: Control refers to the researcher’s ability to eliminate or account for extraneous variables that could influence the results of the study.
- Sampling: The sampling strategy determines how participants are selected and whether the sample is representative of the population.
The Steps in Quantitative Research Methodology
In quantitative studies, a very systematic approach moves from the beginning point of the study (writing a research question) to the end (obtaining an answer). This is a very linear and purposeful flow across the study, and all quantitative research should follow the same sequence.
- Identifying a problem and formulating a research question. Quantitative research begins with a theory. As in, “Something is wrong, and we want to fix it or improve it.” Reflect back to when we discussed research problems and formulating a PICO research question (See Chapter Four). Well, here we are! That is the first step in formulating a quantitative research plan.
- Formulate a hypothesis. This step is key. Researchers need to know exactly what they are testing so that testing the hypothesis can be achieved through specific statistical analyses. The researcher will need to decide their prediction of outcome from their study. It is at this step that they determine if they will be measuring cause-and-effect, a correlation, or perhaps just a description.
- A thorough literature review. At this step, researchers strive to understand what is already known about a topic and what evidence already exists.
- Identifying a framework. When an appropriate framework is identified, the findings of a study may have broader significance and utility (Polit & Beck, 2021).
- Choosing a study design. The research design will determine exactly how the researcher will obtain the answers to the research question(s). The entire design needs to be structured and controlled, with the overarching goal of minimizing bias and errors. The design determines what data will be collected and how, how often data will be collected, what types of comparisons will be made. You can think of the study design as the architectural backbone of the entire study.
- Sampling. The researcher needs to determine a subset of the population that is to be studied. We will come back to the sampling concept in the next module. However, the goal of sampling is to choose a subset of the population that adequate reflects the population of interest.
- Instruments to be used to collect data (with reliability and validity as a priority). Researchers must find a way to measure the research variables (intervention and outcome) accurately. The task of measuring is complex and challenging, as data needs to be collected reliably (measuring consistently each time) and valid. Reliability and validity are both about how well a method measures something. The next module will cover this in detail.
- Obtaining approval for ethical/legal human rights procedures. Methods must be in place to safeguard human rights. Obtain Institutional Review Board approval.
- Data collection. The fun part! Finally, after everything has been organized and planned, the researcher(s) begin to collect data. The pre-established plan (methodology) determines when data collection begins, how to accomplish it, how data collection staff will be trained, and how data will be recorded.
- Data analysis. Here comes the statistical analyses. We will cover this in a later chapter.
- Discussion/Interpretation. After all the analyses have been complete, the researcher then needs to interpret the results and examine the implications. Researchers attempt to explain the findings in light of the theoretical framework, prior evidence, theory, clinical experience, and any limitations in the study now that it has been completed. Often, the researcher discusses not just the statistical significance, but also the clinical significance, as it is common to have one without the other.
- Summary/Dissemination. Part of the final steps of any research project is to disseminate (AKA: share) the findings. This may be in a published article, conference, poster session, etc. The point of this step is to communicate to others the information found through the study. All references are collected so that the researchers can give credit to others.
- Budget and funding. As a last mention in the overall steps, budget and funding for research is a consideration. Research can be expensive. Often, researchers can obtain a grant or other funding to help offset the costs.
| Step | Description |
| Identify the Research Problem | Define the issues and develop a PICO question. |
| Formulate a hypothesis | Clearly state what is being tested. |
| Conduct a Literature Review | Examine existing research and evidence. |
| Identify a framework | Choose a guiding theory or model. |
| Choose a study design | Plan how data will be collected and analyzed. |
| Sampling | Select a representative group from the population. |
| Select instruments for data collection | Ensure measurements are reliable and valid. |
| Obtain ethical and legal approval | Secure IRB approval and protect human rights. |
| Data Collection | Gather information based on the methodology. |
| Data Analysis | Apply statistical methods to interpret data. |
| Discussion/Interpretation | Explain results and their significance. |
| Summary/Dissemination | Share findings through publications or presentations. |
| Budget and Funding | Secure financial support if needed. |
Table Above: Steps in Quantitative Research
Ponder This
How can researchers ensure that a study’s findings are not influenced by confounding variables? Consider a study measuring the effects of a new nursing intervention—what steps should be taken to rule out other factors that might impact the results?
Video Edit: Steps in Quantitative Research video. Step 12 should say “Dissemination” (sharing the results).
Types of Quantitative Research Designs
As we learned in a prior chapter, quantitative research is completely objective. There is no subjectivity to it. Why is this? The purpose of quantitative research is to make an inference about the results to generalize these results to the population. To be able to generalize the findings, they need to be objective in nature. Thus, the design of a study reflects this goal of remaining objective.
Quantitative research designs can be broadly categorized into several types, each serving different research purposes: Descriptive, Experimental, Non-Experimental, Quasi-Experimental, and Time-Dimensional. Understanding these designs is crucial for interpreting and applying research findings to clinical practice.
- Descriptive Designs:
- Method: According to Gray and Grove (2021), this type of research design may be used for theory development, practice problems, rationale for current practice, generating hypotheses, or clinical decision making based on what others are doing.
-
- Characteristics: Descriptive research aims to describe the characteristics of a population or phenomenon without manipulating variables. It provides a snapshot of the current situation. This type of study design is the simplest form of an observational study design. Descriptive research is really helpful when the goal is to examine the occurrence of a phenomenon, observe trends or patterns, or describe a relationship between variables.
-
- Descriptive Design Examples: Surveys that assess patient satisfaction, studies that describe the prevalence of a condition in a population, and observational studies that document clinical practices.
- Experimental Designs:
- Method: Experimental research is designed to test cause-and-effect relationships between variables. This type of design involves the manipulation of an independent variable and the control of extraneous variables. A randomized control trial (RCT) is at the top of the echelon as far as quantitative experimental research. It’s the gold standard of scientific research.
-
- Characteristics:
-
-
- Randomization: To minimize bias, participants are randomly assigned to different groups, such as treatment and control groups. Randomization happens when the researcher makes sure that it is completely random who receives the intervention and who receives the control. The purpose is to make the groups equal regarding all other factors except receipt of the intervention.
- Control Group: A group that does not receive the intervention or receives a standard treatment for comparison. Some participants in the study receive either the standard care, or no intervention at all. This is also called the counterfactual – meaning, it shows what would happen if no intervention was introduced.
- Manipulation/Intervention: The researcher manipulates the independent variable to observe its effect on the dependent variable.
- Experimental Design Example: A randomized controlled trial (RCT) testing the effectiveness of a new drug in lowering blood pressure compared to a placebo.
-
In experimental research, the researcher is seeking to draw a conclusion between an independent variable and a dependent variable. This design attempts to establish cause-effect relationships among the variables. You could think of experimental research as experimenting with “something” to see if it caused “something else”.
Random Sampling vs. Random Assignment
Note – there is a lot of confusion with students (and even some researchers!) when they refer to “random assignment” versus “random sampling”. Random assignment is a signature of a true experiment. This means that if participants are not truly randomly assigned to intervention groups, then it is not a true experiment. Remember, random sampling is a technique used to select individuals from a larger population to be included in a study. The key characteristic of random sampling is that every member of the population has an equal chance of being selected. Random assignment is a process used in experimental research to assign participants to different groups or conditions (e.g., treatment vs. control) in a way that each participant has an equal chance of being placed in any group.
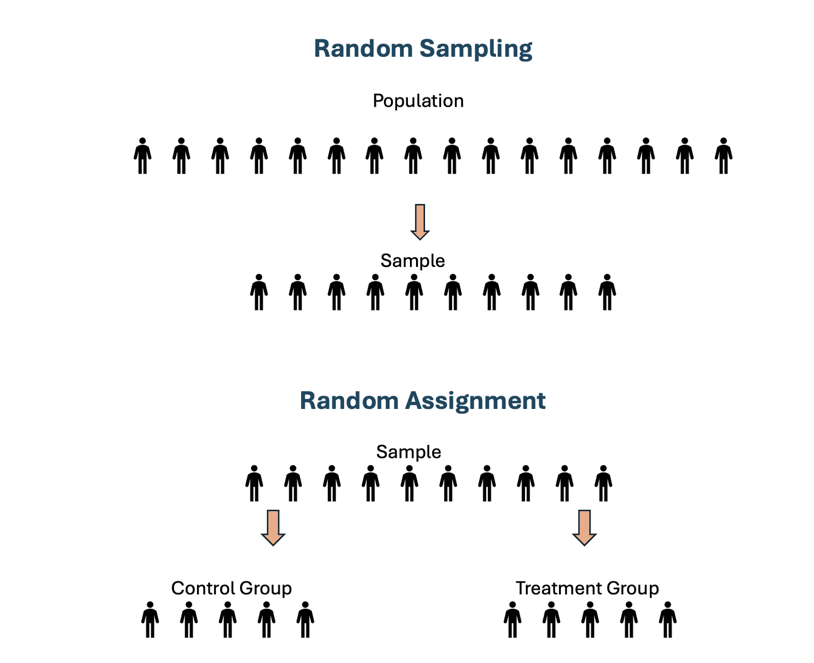
Figure Above: Random Sampling vs. Random Assignment
One very common method for RCT’s is called a pretest-posttest design. This is when the researcher measures the outcome before and after the intervention. For example, if the researcher had an IV (intervention/treatment) of a pain medication, the DV (pain) would be measured before the intervention is given and after it is given. The control group may just receive a placebo. This design permits the researcher to see if the change in pain was caused by the pain medication because only some people received it (Polit & Beck, 2021).

Figure Above: Pretest-Posttest Design
Another experimental design is called a crossover design. This type of design involves exposing participants to more than one treatment. For example, subject 1 first receives treatment A, then treatment B, then treatment C. Subject 2 might first receive treatment B, then treatment A, and then treatment C. In this type of study, the three conditions for an experiment are met: Intervention, randomization, and control – with the subjects serving as their own control group. In the example below (See Figure 7.7), after completing Treatment #1, the patient then “crosses over” and receives Treatment #2. Between treatments, there is usually a period of time called a washout when no treatment is delivered. Outcomes are examined during and/or after each treatment.
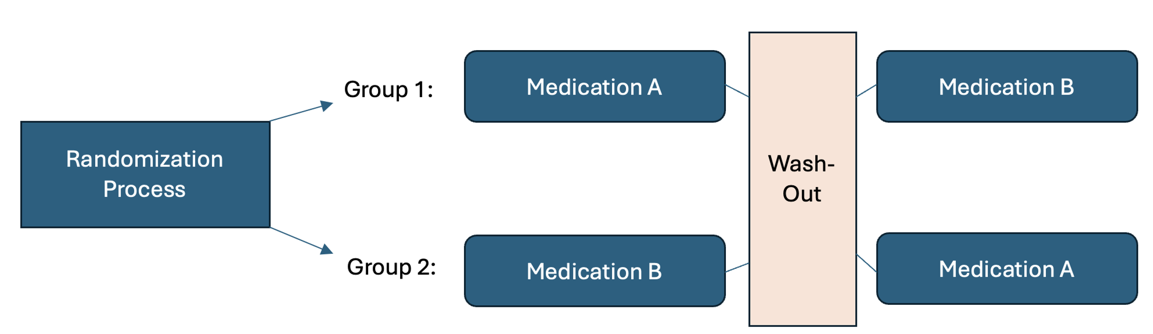
Figure Above: Crossover Design
Control in Experimental Designs
Control is a fundamental concept in quantitative research that refers to the methods used by researchers to eliminate or account for potential issues that could influence the results of a study. Control in experimental designs refers to the strategies researchers use to minimize bias, eliminate confounding variables, and ensure that the observed effects are due to the independent variable rather than external influences. By maintaining control, researchers enhance the internal validity of a study, making it possible to draw accurate cause-and-effect conclusions. This is achieved through careful study design, standardization of procedures, and comparison groups that allow for meaningful analysis of the intervention’s impact. Without proper control, research findings may be unreliable, limiting their applicability to real-world clinical practice.
Types of Control
- Randomization: Randomly assigning participants to different groups (e.g., experimental and control) helps to evenly distribute confounding variables across groups, reducing bias.
- Blinding: In blinding, participants, researchers, or both do not know which group (control or experimental) participants are in, which helps to reduce bias in data collection and interpretation.
- Standardization: Using consistent procedures and protocols for all participants ensures that any differences in outcomes are due to the intervention rather than variations in the study process.
- Control Groups: Including a control group that does not receive the intervention allows researchers to compare the outcomes and determine the effect of the independent variable.
The importance of control cannot be overstated. Effective control increases the internal validity of a study, ensuring that the results are due to the manipulation of the independent variable rather than other factors.
3. Non-Experimental Designs:
-
- Purpose: Non-experimental research explores relationships between variables without manipulating them. It is often used when experimental designs are not feasible or ethical.
-
- Characteristics:
- Correlation: Non-experimental designs often explore correlations between variables, but they do not establish causation.
- Observation: Researchers observe and measure variables as they naturally occur.
- Example: A study examining the relationship between smoking and lung cancer using observational data.
- Characteristics:
Sometimes, cause-problem research questions cannot be answered with an experimental or quasi-experimental design because the IV cannot be manipulated. For example, if we want to measure what impact prerequisite grades have on student success in nursing programs, we obviously cannot manipulate the prerequisite grades. In another example, if we wanted to investigate how low birth weight impacts developmental progression in children, we cannot manipulate the birth weight. You will often see the word “observational” instead of non-experimental research. This does not mean the researcher is just standing and watching people, but instead it refers to the method of observing data that has already been established without manipulation.
There are various types of non-experimental research:
Correlational research: A correlational research design investigates relationships between two variables (or more) without the researcher controlling or manipulating any of them. In the example of prerequisites and nursing program success, that is a correlational design.
Cohort design (also called a prospective design): In a cohort study, the participants do not have the outcome of interest to begin with. They are selected based on the exposure status of the individual. They are then followed over time to evaluate for the occurrence of the outcome of interest.
Retrospective design: In retrospective studies, the outcome of interest has already occurred (or not occurred – e.g., in controls) in each individual by the time s/he is enrolled, and the data are collected either from records or by asking participants to recall exposures. There is no follow-up of participants.
Case-control design: A study that compares two groups of people: those with the disease or condition under study (cases) and a very similar group of people who do not have the condition.
Descriptive research: Descriptive research design is a type of research design that aims to obtain information to systematically describe a phenomenon, situation, or population. More specifically, it helps answer the what, when, where, and how questions regarding the research problem, rather than the why. For example, the researcher might wish to discover the percentage of motorists who tailgate – the prevalence of a certain behavior.
Secondary analysis: Secondary analysis type of research involves the use of pre-existing data collected from previous studies to answer new research questions or explore different aspects of the original data. Unlike primary research, which collects new data, secondary analysis reinterprets or synthesizes existing data to generate new insights, identify trends, or strengthen evidence-based practice.
Meta-analysis: A meta-analysis is a type of secondary research that combines and statistically analyzes data from multiple independent studies on a specific topic to determine overall trends or effect sizes. By pooling results from different studies, meta-analysis increases statistical power and provides a more precise estimate of an intervention’s effectiveness or an association between variables. It is commonly used in healthcare and evidence-based practice to synthesize research findings and guide clinical decision-making. Note: Meta-analysis for quantitative designs focuses on statistical methods and is not to be confused with meta-synthesis of qualitative designs, which focuses on individual studies that are pooled.
4. Quasi-Experimental Designs:
-
- Purpose: Quasi-experimental research involves an intervention but lacks the full control of an experimental design, particularly in terms of randomization.
-
- Characteristics:
- Non-Random Assignment: Participants are not randomly assigned to groups, which may introduce bias.
- Intervention: An independent variable is manipulated, and its effects are measured.
- Control: Some control is exercised, but not as rigorously as in true experiments.
- Example: A study evaluating the impact of a new training program on nurse job satisfaction in two hospital units, where random assignment to the program is not possible.
- Characteristics:
Quasi-experiments involve an experiment just like true experimental research. However, they lack randomization and some even lack a control group. Therefore, there is implementation and testing of an intervention, but there is an absence of randomization.
For example, perhaps we wanted to measure the effect of yoga for nursing students. The IV (intervention of yoga) is being offered to all nursing students and therefore randomization is not possible. For comparison, we could measure quality of life data on nursing students at a different university. Data is collected from both groups at baseline and then again after the yoga classes. Note, that in quasi-experiments, the phrase “comparison group” is sometimes used instead of “control group” against which outcome measures are collected. Sometimes there is no comparison group either. This would be called a one-group pretest-posttest design.
5. Time-Dimensional Designs:
-
- Purpose: Time-dimensional designs focus on how variables or conditions change over time. They are useful for studying the development of outcomes or the long-term effects of interventions.
-
- Types:
- Cross-Sectional: Data is collected at a single point in time, providing a snapshot of the current state of variables. Retrospective studies are usually cross-sectional, in which the independent variable concerns events or behaviors occurring in the past.
- Longitudinal: Data is collected from the same subjects over an extended period, allowing researchers to observe changes and developments over time. Longitudinal designs are better at showing patterns of change and at clarifying whether a cause occurred before an effect (outcome). A challenge in longitudinal studies is attrition or the loss of participants over time.
- Example: A longitudinal study tracking the progression of diabetes in a cohort of patients over five years.
- Types:
![]() Hot Tip! Not all research designs are equal. Randomized Controlled Trials (RCTs) provide the strongest evidence, while descriptive and observational studies offer valuable insights but don’t prove cause-and-effect. Know the research hierarchy to assess study credibility!
Hot Tip! Not all research designs are equal. Randomized Controlled Trials (RCTs) provide the strongest evidence, while descriptive and observational studies offer valuable insights but don’t prove cause-and-effect. Know the research hierarchy to assess study credibility!
Ponder This
Why is it important to balance ethical considerations with scientific rigor in quantitative research? In studies involving control groups, how can researchers maintain fairness while still gathering meaningful, unbiased data?
To understand the difference between experimental and nonexperimental research, please watch this wonderful video by Jenny Barrow, MSN, RN, CNE, that explains experimental versus nonexperimental research.
(Jenny Barrow, 2019)
Evidential Strength in Quantitative Research Design
Quantitative research is valued for its ability to produce strong, reliable evidence through systematic and objective data collection. The strength of evidence varies based on the research design, with some methods providing more confidence in results than others.
Experimental designs offer the highest level of evidential strength. Randomized controlled trials (RCTs) are considered the gold standard because they minimize bias through random assignment and strict control of variables. These studies provide strong internal validity, allowing researchers to establish cause-and-effect relationships. Quasi-experimental designs, while similar, lack full randomization, making them slightly less rigorous but still valuable for assessing interventions and outcomes.
Observational designs provide moderate evidential strength. Cohort studies track groups over time, offering insights into causal relationships, though they are more susceptible to confounding variables than experimental studies. Case-control studies compare groups retrospectively, which can identify associations but may introduce recall bias. Cross-sectional studies, which capture data at a single point in time, are useful for identifying trends but cannot determine causality.
Descriptive and correlational studies generally provide lower levels of evidential strength. Descriptive studies focus on summarizing characteristics of a population without testing relationships, while correlational studies explore associations between variables but do not establish cause and effect. These designs are useful for generating hypotheses and identifying patterns but lack the rigor needed to make definitive conclusions.
Several factors influence the overall strength of evidence in quantitative research. Randomization reduces bias, while the inclusion of control groups enhances validity by providing a baseline for comparison. Larger sample sizes improve generalizability and statistical power, ensuring that findings are not due to chance. Additionally, the reliability and validity of measurement tools play a crucial role in maintaining accuracy and consistency in data collection.
The choice of study design depends on the research question, the nature of the variables, and the feasibility of manipulating the independent variable. Understanding the strengths and limitations of each design is crucial for interpreting the findings of quantitative research.
| Research Design | Evidential Strength | Description |
| Randomized Controlled Trials (RCTs) | Highest | Considered to the the gold standard, RCTs use random assignment and control groups to minimize bias and establish causation. |
| Quasi-Experimental Designs | High | Similar to RCTs but lack full randomization, making them slightly weaker in establishing causality. |
| Cohort Studies | Moderate to High | Follows a a group over time to identify cause-and-effect relationships. Stronger than case-control studies but susceptible to confounding variables. |
| Case-Control Studies | Moderate | Compares groups retrospectively to find associations |
| Cross-Sectional Studies | Moderate | Captures data at a single point in time. Useful for identifying trends but cannot establish causation. |
| Descriptive Studies | Low | Observes and summarizes data without testing relationships or causality. |
| Correlational Studies | Low to Moderate | Examines relationships between variables but cannot indicate causation. |
| Factors Affecting Evidential Strength | Varies | Elements such as randomization, control groups, and reliability of measurement tools impact the strength of findings. |
Table Above: Evidential Strength in Quantitative Studies
Practical Application: Evaluating the Impact of Nurse-Led Education on Pre-Surgical Anxiety: A Quantitative Approach
A hospital wants to evaluate whether a structured nurse-led education program reduces patient anxiety before surgery. Previous studies suggest education may help, but quantitative evidence in this specific setting is lacking.
Activity: Researchers conduct a randomized controlled trial (RCT) where one group of patients receives the nurse-led education program, while a control group receives standard care. Anxiety levels are measured before and after the intervention using a validated questionnaire.
Ethical Issue: Some patients in the control group express concern about not receiving the education program, feeling they may be at a disadvantage in managing their anxiety.
Conclusion: The study highlights the ethical balance between maintaining research integrity and ensuring fair treatment. To address concerns, researchers plan to offer the education program to the control group after data collection concludes.
Population or Observation Studies and Their Place in the Evidential Hierarchy
Population or observational studies are non-experimental research designs that examine variables in real-world settings without direct intervention. These studies help researchers understand relationships between variables, trends, and potential risk factors. Since they do not involve randomization or controlled interventions, they are generally considered to have moderate to low evidential strength compared to experimental studies.
Types of Observational Studies and Their Evidential Strength
- Cohort Studies – These follow a group over time to assess how exposure to a certain factor influences outcomes. They provide stronger evidence than case-control studies but can be affected by confounding variables.
- Case-Control Studies – These compare individuals with a condition (cases) to those without (controls) to identify risk factors. They rely on retrospective data, which may introduce recall bias.
- Cross-Sectional Studies – These capture data at a single point in time and are useful for identifying associations but cannot determine causation.
- Descriptive Studies – These summarize data without analyzing relationships or causation and provide the weakest level of evidence.
Systematic Reviews and Meta-Analyses in the Evidential Hierarchy
Systematic reviews (SRs) and meta-analyses sit at the top of the evidential hierarchy because they synthesize data from multiple studies, reducing bias and increasing generalizability.
- Systematic Reviews: A systematic review is a comprehensive, structured summary of existing research on a specific topic. It follows a rigorous methodology to identify, evaluate, and synthesize findings from multiple studies, reducing bias and ensuring reliability.
- Meta-Analyses: A meta-analysis is a statistical technique used within a systematic review to combine data from multiple studies, increasing the overall sample size and improving the strength of conclusions. By pooling results, meta-analyses enhance statistical power and provide more precise estimates of effect sizes, making them one of the highest forms of evidence in research.
Evidential Hierarchy Placement
- Meta-Analyses and Systematic Reviews – Highest level of evidence as they aggregate findings from multiple high-quality studies. (Level 1 on our LOE Pyramid).
- Randomized Controlled Trials (RCTs) – Provide strong causal evidence due to randomization and controlled conditions. (LOE 2)
- Cohort Studies – Offer moderate evidence by following participants over time but may be influenced by external factors. (LOE 5)
- Case-Control Studies – Provide weaker evidence than cohort studies due to reliance on retrospective data. (LOE 5)
- Cross-Sectional Studies – Useful for identifying associations but lack temporal data to determine causality. (LOE 5)
- Descriptive and Observational Studies – Provide the lowest level of evidence as they only describe data without establishing relationships. (Observational LOE 5, Descriptive LOE 7)
Cause-and-Effect (Causality) Versus Association/Correlation
A very important concept to understand is cause-and-effect, also known as causality, versus correlation. Let’s look at these two concepts in very simplified statements. Causation means that one thing caused another thing to happen. Correlation means there is some association between the two thing we are measuring.
It would be nice if it were as simple as that. These two concepts can indeed by confused by many. Let’s dive deeper.
Two or more variables are considered to be related or associated, in a statistical context, if their values change so that as the value of one variable increases or decreases so does the value of the other variable (or the opposite direction).
For example, for the two variables of “hours worked” and “income earned”, there is a relationship between the two if the increase in hours is associated with an increase in income earned.
However, correlation is a statistical measure that describes the size and direction of a relationship between two or more variables. A correlation does not automatically mean that the change in one variable caused the change in value in the other variable.
Theoretically, the difference between the two types of relationships is easy to identify — an action or occurrence can cause another (e.g. smoking causes an increase in the risk of developing lung cancer), or it can correlate with another (e.g. smoking is correlated with alcoholism, but it does not cause alcoholism). In practice, however, it remains difficult to clearly establish cause and effect, compared with establishing correlation.
Simplified in this image, we can say that hot and sunny weather causes an increase in ice cream consumption. Similarly, we can demise that hot and sunny weather increases the incidence of sunburns. However, we cannot say that ice cream caused a sunburn (or that a sunburn increases consumption of ice cream). It is purely coincidental. In this example, it is pretty easy to anecdotally surmise correlation versus causation. However, in research, we have statistical tests that help researchers differentiate via specialized analyses.
Here is a great Khan Academy video of about 5 minutes that shows a worked example of correlation versus causation with regard to sledding accidents and frostbite cases:
Reliability in Quantitative Research
Reliability in quantitative research refers to the consistency, stability, and repeatability of a measurement or research instrument. It is a critical concept because reliable measurements ensure that the data collected are dependable and can be replicated under similar conditions. When a research instrument or measurement method is reliable, it yields consistent results across different occasions, raters, and items. This consistency is crucial for drawing valid conclusions and making informed decisions based on the research findings.
Types of Reliability
Test-Retest Reliability: Test-retest reliability assesses the stability of a measurement over time. It is determined by administering the same test to the same group of individuals at two different points in time and then comparing the scores.
Example: Suppose a researcher develops a questionnaire to measure stress levels in nursing students. If the questionnaire is administered to the same group of students twice, with a week between administrations, and the scores are similar both times, the instrument is considered to have high test-retest reliability.
Ponder This
How might the time interval between tests affect the test-retest reliability of a measurement tool? What factors could cause fluctuations in the test scores over time, even when the construct being measured (e.g., stress) has not changed?
Inter-Rater Reliability: Inter-rater reliability evaluates the degree of agreement or consistency between different raters or observers assessing the same phenomenon. It is crucial in studies where subjective judgments are involved, such as clinical observations or diagnostic assessments.
Example: Imagine a study where nurses are asked to rate the severity of patients’ pain using a standardized pain scale. If all nurses give similar ratings for the same patients, the pain scale has high inter-rater reliability. However, if the ratings vary significantly between nurses, the tool might have low inter-rater reliability, indicating a need for better training or a more objective assessment tool.
Ponder This
What strategies can be implemented to improve inter-rater reliability among healthcare professionals using the same assessment tool?
How might cultural or personal biases of raters influence inter-rater reliability, and what steps can be taken to minimize these biases?
Internal Consistency: Internal consistency refers to the extent to which all items within a test or measurement tool assess the same underlying construct. It is commonly measured using Cronbach’s alpha, which provides a coefficient that ranges from 0 to 1. A higher alpha value indicates greater internal consistency.
Example: Consider a questionnaire designed to measure job satisfaction among nurses. If the questionnaire has multiple items, such as satisfaction with salary, work environment, and professional development opportunities, all these items should consistently reflect the overall construct of job satisfaction. If some items do not correlate well with others, the internal consistency of the tool may be low.
Ponder This
How can researchers ensure that all items in a questionnaire measure the same construct effectively? What is an acceptable level of Cronbach’s alpha for a reliable measurement tool, and how should researchers interpret values that are too high or too low?
Importance of Reliability in Quantitative Research
Reliability is essential for several reasons:
- Consistency of Results: Reliable measurements produce consistent results across different conditions, times, and raters. This consistency is fundamental for establishing trust in the research findings.
- Replication of Studies: When research tools and instruments are reliable, other researchers can replicate the study in different settings or with different populations, which strengthens the evidence base in nursing practice.
- Accurate Interpretation: Reliable data allows researchers to accurately interpret the results and draw valid conclusions. Without reliability, the findings may be questioned, leading to uncertainty in clinical decision-making.
- Improved Measurement Tools: By assessing and improving the reliability of measurement tools, researchers can ensure that these tools are more effective in capturing the constructs they are intended to measure, leading to more robust and meaningful research outcomes.
Challenges in Achieving Reliability
Despite its importance, achieving high reliability in quantitative research can be challenging. Some common challenges include:
- Measurement Error: Various factors, such as environmental conditions, participant mood, and instrument calibration, can introduce errors in measurement, reducing reliability.
- Example: A blood pressure monitor that is not calibrated correctly might give inconsistent readings, leading to unreliable data.
- Rater Bias: In assessments involving human judgment, individual biases can affect reliability. Differences in training, experience, and personal perspectives can lead to variability in how raters assess the same phenomenon.
- Example: Two nurses might rate the severity of a patient’s pain differently based on their personal experiences with pain management.
- Test Fatigue: If a test is too long or repetitive, participants may become fatigued or bored, leading to inconsistent responses and reduced reliability.
- Example: In a lengthy survey, respondents might lose focus and start answering questions carelessly, resulting in unreliable data.
- Time Interval in Test-Retest Reliability: The time interval between test administrations can affect reliability. If the interval is too short, participants may remember their previous responses, leading to artificially high reliability. If too long, real changes in the construct being measured might occur, leading to lower reliability.
- Example: Measuring anxiety levels in students immediately before and after a major exam might yield different results, not due to a lack of reliability, but because the students’ anxiety genuinely changes.
Strategies to Improve Reliability
To enhance reliability in quantitative research, researchers can implement several strategies:
- Standardization: Use standardized procedures and protocols for data collection to minimize variability due to external factors.
- Example: Ensure that all nurses in a study receive the same training on how to use a pain assessment tool to reduce inter-rater variability.
- Pilot Testing: Conduct pilot studies to test the reliability of measurement tools before the main study. This allows researchers to identify and address potential issues with the tool.
- Example: Administer a new questionnaire to a small group of participants to assess its internal consistency and make necessary revisions.
- Training for Raters: Provide thorough training and calibration sessions for raters to ensure they understand how to use assessment tools consistently.
- Example: Implement regular training sessions for nurses on how to assess pressure ulcers consistently using a standardized scale.
- Clear Instructions: Provide clear and unambiguous instructions to participants to reduce variability in how they interpret and respond to survey items or tests.
- Example: Use simple, straightforward language in questionnaires to avoid confusion and ensure that all participants understand the questions similarly.
- Appropriate Time Intervals: Choose appropriate time intervals for test-retest reliability assessments, considering the stability of the construct being measured.
-
- Example: When assessing the reliability of a stress measurement tool, select a time interval that balances the risk of recall bias with the potential for genuine changes in stress levels.
High reliability ensures that the results of a study can be replicated and that the measurements are dependable. Without reliability, it is difficult to trust the findings of a study. Reliability is a cornerstone of quantitative research, ensuring that the data collected are consistent, stable, and trustworthy. By understanding and addressing the factors that influence reliability, researchers can enhance the quality of their studies, leading to more accurate and meaningful findings. As you progress in your nursing education and begin to engage with research, always consider the reliability of the tools and methods you use, as this will significantly impact the validity and applicability of your research outcomes.
Validity in Quantitative Research
Validity refers to the accuracy of a measurement or the extent to which a research instrument measures what it is intended to measure. There are several types of validity that are crucial for ensuring the credibility of research findings.
Types of Validity
- Internal Validity: Refers to the degree to which a study establishes a cause-and-effect relationship between variables. High internal validity means that the results can confidently be attributed to the independent variable rather than confounding factors.
- Threats to Internal Validity: History (events outside the study), maturation (changes in participants over time), and instrumentation (changes in measurement tools).
-
- Example Scenario: Imagine a study examining the effect of a new educational program on nursing students’ test scores. To ensure high internal validity, the researcher randomly assigns students to either the new program (intervention group) or the standard program (control group). If the intervention group shows significantly higher test scores, the researcher can reasonably conclude that the educational program caused the improvement, assuming other factors (e.g., prior knowledge, teaching quality) are controlled. If, during the study, one group of students receives additional tutoring outside the program, this could threaten internal validity by introducing a confounding variable. The observed effect on test scores might be due to the extra tutoring rather than the educational program itself.
- External Validity: Concerns the extent to which the findings of a study can be generalized to other populations, settings, or times.
- Threats to External Validity: Sample characteristics that are not representative of the population, artificial research settings, and interaction effects of testing.
-
- Example Scenario: A study conducted in a large urban hospital finds that a nurse-led intervention significantly reduces patient anxiety. If the study has high external validity, the findings should be applicable to patients in other settings, such as rural hospitals or outpatient clinics, suggesting that the intervention could be effectively implemented across diverse healthcare environments. If the study only includes participants from a single urban hospital with a specific demographic (e.g., predominantly middle-aged, English-speaking patients), the findings might not generalize to other populations, such as younger patients, non-English speakers, or those in rural areas. This limits the external validity of the study.
- Construct Validity: The degree to which a test or instrument measures the theoretical construct it is intended to measure.
- Threats to Construct Validity: Poorly defined constructs, lack of alignment between the construct and measurement, and experimenter bias.
-
- Example Scenario: A researcher develops a questionnaire to measure the construct of “nurse burnout.” The questionnaire includes items related to emotional exhaustion, depersonalization, and reduced personal accomplishment—all key components of burnout as defined in the literature. If the questionnaire reliably measures these components and correlates well with other established burnout measures, it has high construct validity. If the questionnaire includes items that measure job satisfaction rather than burnout, the construct validity could be compromised. The tool might be measuring a related but distinct construct (job satisfaction) instead of burnout, leading to inaccurate conclusions about the levels of burnout among nurses.
- Content Validity: The extent to which a measurement reflects the entire range of the concept being measured.
- Example: A pain assessment tool should cover all aspects of pain, including intensity, duration, and impact on daily activities.
-
- Example Scenario: A new pain assessment tool is developed to measure pain in postoperative patients. To ensure high content validity, the tool includes items assessing pain intensity, duration, type (e.g., sharp, dull), and the impact of pain on daily activities. This comprehensive approach ensures that all relevant aspects of pain are measured, providing a complete picture of the patient’s experience. If the pain assessment tool only measures pain intensity but ignores other important aspects like the duration or the emotional impact of pain, the tool would lack content validity. It would not fully capture the patient’s pain experience, leading to incomplete or misleading assessments.
Validity is crucial for ensuring that the conclusions drawn from a study are accurate and applicable. Without validity, even reliable measurements can be misleading. As a summary of reliability versus validity, remember that reliability wants to know: Is the blood glucose meter measuring the same way, every time? Validity is asking, “Does the blood glucose meter measure what it is supposed to measure?”
| Term | Definition | Importance | Application |
| Reliability | Measures the ability of a measure to consistently measure the same way. | This is important for consistent measures of a construct. | For example, when measuring a patient’s blood pressure, the blood pressure cuff should consistently measure in the same way. So, when doing every 15-minute vital signs after surgery, the cuff should measure consistently every 15 minutes. |
| Validity | Measures the concept it is supposed to measure. | This is important to be able to measure the intended construct. | For example, as measure of critical thinking is an accurate measure of critical thinking and not expert practice. |
![]() Hot Tip! Reliability vs. Validity – Know the Difference! A research tool is reliable if it produces consistent results and valid if it actually measures what it claims to. A faulty thermometer may always show the same temperature (reliable) but be completely incorrect (not valid)!
Hot Tip! Reliability vs. Validity – Know the Difference! A research tool is reliable if it produces consistent results and valid if it actually measures what it claims to. A faulty thermometer may always show the same temperature (reliable) but be completely incorrect (not valid)!
Ethical Dilemma Example
You are conducting a quantitative study to evaluate the effectiveness of a new medication for managing chronic pain. During data collection, you notice that some participants in the control group are seeking additional pain relief methods outside of the study protocol, which could compromise the study’s internal validity. Excluding these participants from the final analysis might preserve the validity of your findings, but it would reduce your sample size and potentially introduce bias. This situation presents a conflict between maintaining the scientific rigor of your study and ensuring fair and inclusive representation of all participants.
In summary, we explored the foundational aspects of quantitative research, which is central to evidence-based practice in nursing. Quantitative research provides the empirical data needed to inform clinical decision-making and improve patient outcomes. The chapter began by discussing the importance of understanding variables—independent, dependent, confounding, and extraneous—within research.
We then studied different types of quantitative research designs, including descriptive, experimental, non-experimental, time-dimensional, and quasi-experimental designs. Each design serves a unique purpose and is chosen based on the research question and the nature of the variables involved.
Furthermore, the chapter highlighted the critical role of control in quantitative research, ensuring that a study’s results are valid and reliable. Reliability and validity were discussed in detail, emphasizing their significance in ensuring the accuracy and consistency of research findings. Through practical examples and case studies, the chapter illustrated how these concepts apply to real-world nursing research.
By understanding these key concepts, you are now better equipped to critically appraise quantitative research studies, apply their findings to your practice, and contribute to the growing body of evidence in nursing. This knowledge will empower you to make informed decisions that enhance patient care and advance the nursing profession.
Summary Points
Quantitative research is systematic, numerical, and objective—providing the foundation for EBP in nursing by allowing results to be generalized to larger populations.
Research cannot “prove” or “disprove”—it can only support hypotheses with statistically significant evidence; reproducibility strengthens findings.
Independent variables (IVs) are manipulated to assess their effect; dependent variables (DVs) are outcomes measured; IVs cause or influence DVs.
Confounding variables are unmeasured third variables that affect both IVs and DVs (e.g., temperature affecting both ice cream consumption and sunburn).
Extraneous variables are uncontrolled influences that may affect DVs; control variables are held constant to prevent interference.
Control in research (randomization, blinding, standardization, control groups) strengthens internal validity and reduces bias.
Quantitative research methodology steps: define problem → hypothesis → literature review → framework → design → sampling → instruments → ethics → data collection → analysis → interpretation → dissemination.
Experimental designs (true experiments, RCTs) meet three conditions: intervention, control, randomization—highest evidential strength.
Quasi-experimental designs involve interventions but lack full randomization; still valuable but with slightly less rigor than RCTs.
Non-experimental designs (correlational, cohort, case-control, cross-sectional) examine variables without manipulation—useful for associations but not causation.
Time-dimensional designs: cross-sectional studies capture one moment in time; longitudinal studies follow participants over time, showing trends and patterns.
Evidential hierarchy: Meta-analysis & systematic reviews (highest) → RCTs → quasi-experimental → cohort → case-control → cross-sectional → descriptive/correlational studies (lowest).
Causation vs correlation: correlation shows association, causation proves directional influence; confounding must be controlled to establish causation.
Reliability = consistency of measurement (test-retest, inter-rater, internal consistency); a tool can be reliable but not valid.
Validity = accuracy (measures what it claims to measure); includes internal, external, construct, and content validity.
Internal validity ensures observed effects are due to IV, not confounders; external validity concerns generalizability of results to other settings.
Construct validity checks alignment between theory and measurement; content validity ensures full coverage of the concept.
Reliability vs validity: Reliability = “Is it consistent?”; Validity = “Is it correct?”; a method needs both to produce meaningful results.
Ethical considerations balance scientific rigor with participant fairness, e.g., control groups often receive intervention post-study to maintain equity.
Ponder This
Imagine you are conducting a study to evaluate the effectiveness of a new pain management protocol in a hospital setting. The protocol involves multiple steps, and different nurses will be responsible for implementing it.
How would you ensure the reliability of the data collected across different shifts, units, and nurses? Consider the challenges you might face and how you would address them.
Ponder This
You are a nursing student preparing to evaluate a new patient monitoring system designed to reduce falls in a hospital unit. The research team collects numerical data on fall rates before and after implementing the system, but you notice that staff training on the new technology varied widely. As you analyze the results, you consider how inconsistencies in training might impact the study’s validity and the conclusions drawn from the data.
Case Study: Evaluating the Effectiveness of a New Fall Prevention Program in a Hospital Setting
St. Joseph’s Hospital, a medium-sized urban hospital, has been experiencing a higher-than-average incidence of patient falls, particularly among elderly patients in the general medical-surgical unit. Recognizing the serious implications of patient falls, including the potential for injury and increased length of stay, the hospital’s nursing leadership team decided to implement a new fall prevention program. This program included regular staff training on fall prevention techniques, the use of bed alarms, and personalized patient mobility assessments.
To determine the effectiveness of the new fall prevention program, the hospital’s quality improvement team decided to conduct a quantitative research study. The primary objective was to evaluate whether the new program would significantly reduce the incidence of falls in the medical-surgical unit compared to the previous standard practices.
Actions Taken
- Study Design: The team chose a quasi-experimental design for the study, with the medical-surgical unit serving as the intervention group and a similar unit in another hospital without the new program serving as the control group. Randomization was not possible due to the nature of the intervention, but the two units were matched on key characteristics such as patient demographics and baseline fall rates.
- Data Collection:
- o Pre-Intervention Data: Baseline data on fall rates were collected for three months before implementing the new fall prevention program in the intervention unit. During the same period, fall rates were also recorded in the control unit.
- o Intervention: The new fall prevention program was implemented in the medical-surgical unit at St. Joseph’s Hospital. Staff received training, and the new procedures, including the use of bed alarms and personalized mobility assessments, were put into practice.
- o Post-Intervention Data: Fall rates were recorded for three months following the implementation of the program in both the intervention and control units.
- Analysis: The team conducted a statistical analysis comparing the fall rates before and after the intervention in both the intervention and control units. They used a chi-square test to determine if there was a statistically significant reduction in falls in the intervention unit compared to the control unit.
Results
The analysis revealed the following results:
- Intervention Unit (St. Joseph’s Hospital):
- Pre-Intervention Fall Rate: 15 falls per 1,000 patient days
- Post-Intervention Fall Rate: 8 falls per 1,000 patient days
- The reduction in falls was statistically significant, with a p-value of 0.01.
- Control Unit (Comparison Hospital):
- Fall rates remained relatively stable, with no significant change between the pre-intervention and post-intervention periods.
The findings indicated that the new fall prevention program led to a significant reduction in the incidence of falls in the intervention unit, whereas no such reduction was observed in the control unit.
Conclusion
The quantitative research study demonstrated that the new fall prevention program at St. Joseph’s Hospital effectively reduced patient falls in the medical-surgical unit.
The significant decrease in fall rates following the implementation of the program suggests that the combination of staff training, bed alarms, and personalized mobility assessments played a crucial role in improving patient safety.
Based on the positive results, the hospital’s leadership team decided to expand the fall prevention program to other units within the hospital. Additionally, the study’s findings were shared with other hospitals in the healthcare system, prompting several to consider adopting similar fall prevention strategies.
This case study highlights the importance of using quantitative research to evaluate the effectiveness of interventions in healthcare settings. By systematically collecting and analyzing data, healthcare professionals can make evidence-based decisions that lead to improved patient outcomes and safer clinical environments.
![]() Critical Appraisal! Critical Appraisal Questions: Quantitative Studies
Critical Appraisal! Critical Appraisal Questions: Quantitative Studies
Research Question and Objectives:
- Is the research question clearly stated, and are the objectives well-defined?
- Does the study address a significant problem or gap in the literature?
Study Design:
- Is the study design appropriate for answering the research question (e.g., experimental, quasi-experimental, descriptive)?
- Is the design clearly described, including whether it is randomized, blinded, or controlled?
Sampling:
- Is the sampling method clearly described and appropriate for the study design (e.g., probability vs. nonprobability sampling)?
- Are the inclusion and exclusion criteria explicitly stated and justified?
- Is the sample size adequate to detect a statistically significant effect?
Randomization and Group Allocation:
- If applicable, was randomization used, and was it conducted appropriately?
- Are the methods for group allocation described and free from bias?
Intervention and Control:
- Is the intervention or treatment clearly defined and replicable?
- Are control or comparison groups adequately described and appropriate?
Blinding:
- Was blinding used to reduce bias (e.g., blinding of participants, researchers, or outcome assessors)?
- If blinding was not used, is this justified?
Measurement and Data Collection:
- Are the measurement tools and instruments reliable and valid for the outcomes being measured?
- Is the data collection process clearly described and standardized?
Variables:
- Are the independent and dependent variables clearly defined and measured appropriately?
- Were confounding variables identified and controlled for?
Statistical Analysis:
- Are the statistical methods used appropriate for the study design and type of data?
- Are the analyses clearly described, and are the results presented with appropriate measures of variability (e.g., confidence intervals, p-values)?
Results:
- Are the results presented clearly, with sufficient detail to evaluate the findings?
- Are tables and figures used effectively to enhance the presentation of results?
Validity:
- Are threats to internal validity (e.g., selection bias, attrition, confounding) addressed?
- Is external validity considered, and are the results generalizable to the population of interest?
Reliability:
- Are the methods used to collect and analyze data reliable?
- Is there consistency in the application of procedures and measurement instruments?
Ethical Considerations:
- Were ethical approvals obtained, and are ethical considerations (e.g., informed consent, confidentiality) adequately addressed?
- Was the study conducted in a manner that protects the rights and well-being of participants?
Bias:
- Are potential sources of bias identified and minimized?
- Is there evidence of selective reporting or conflict of interest?
Interpretation of Findings:
- Are the findings interpreted in the context of the existing literature and study limitations?
- Are conclusions drawn supported by the data?
Limitations:
- Are the study’s limitations clearly stated and discussed?
- How do the limitations impact the interpretation of the results?
Implications for Practice:
- Are the practical implications of the findings for clinical practice or further research discussed?
- Does the study provide actionable recommendations based on the results?
Funding and Conflicts of Interest:
- Is the source of funding disclosed, and does it appear to influence the study’s design, conduct, or reporting?
- Are conflicts of interest clearly stated?
References & Attribution
“Light bulb doodle” by rawpixel licensed CC0.
“Magnifying glass” by rawpixel licensed CC0
“Orange flame” by rawpixel licensed CC0.
Jenny Barrow. (2019). Experimental versus nonexperimental research. https://www.youtube.com/watch?v=FJo8xyXHAlE
Bass, P.F., & Maloy, J. W. (2020). How to determine if a project is human subjects research, a quality improvement project, or both. Ochsner Journal, 20(1): 56-61.
Gray, J., & Grove, S. K. (2021). Burns and Grove’s The practice of nursing research: Appraisal, synthesis, and generation of evidence (9th ed.). Saunders Elsevier.
Heavey, E. (2019). Statistics for nursing: A practical approach. Jones & Bartlett Learning.
Leibold, N. (2020). Research variables. Measures and Concepts Commonly Encountered in EBP. Creative Commons License: BY NC
Polit, D. & Beck, C. (2021). Lippincott CoursePoint Enhanced for Polit’s Essentials of Nursing Research (10th ed.). Wolters Kluwer Health.
Ratanasiripong, P., Kaewboonchoo, O., Ratanasiripong, N., Hanklang, S., Chumchai, P. (2015). Biofeedback intervention for stress, anxiety, and depression among graduate students in public health nursing. Nurs Res Pract, 2015:160746. doi: 10.1155/2015/160746.
Schroeder, K., Dumenci, L., Sarwer, D. B., Wheeler, D. C., & Hayat, M. J. (2022). Increasing quantitative literacy in nursing: A joint nursing-statistician perspective. Journal of Advanced Nursing, 78(4), e66–e68. https://doi.org/10.1111/jan.15150
