8 Exploring Barriers to Diversity, Equity, and Inclusion in Communication Sciences and Disorders Students
Elizabeth Cleveland; Maysoon Biller; Natalie Benafield; Abigail Moss; Mackenzie Jordan; and Mary Yang
Cleveland, Elizabeth; Biller, Maysoon; Benafield, Natalie; Moss, Abigail; Jordan, Mackenzie; and Yang, Mary (2023) “Exploring Barriers to Diversity, Equity, and Inclusion in Communication Sciences and Disorders Students,” Developmental Disabilities Network Journal: Vol. 3: Iss. 1, Article 9.
Plain Language Summary
This article is about a research project at a university. The participants in this study were 62 students who were studying communication disorders. In this project, the researchers asked students about challenges they faced in their program of study. The researchers wanted to see if there were any differences between White students and Black, Indigenous, and People of Color (BIPOC) students. The study results showed that BIPOC students felt that faculty and classmate support of diversity was “very important.” White students were more likely than BIPOC students to report no challenges or barriers in their program. Both White and BIPOC students said that more scholarships would be helpful, and half of the students said that working while in school made school more difficult. The results of this study may help university programs understand the needs of BIPOC students, although more research is needed to identify specific approaches that would be helpful.
Abstract
Introduction:
This study investigated university students’ views of barriers and aids toward success in a communication sciences and disorders (CSD) program. The goal of this 11-question survey was to determine if there was a difference in types of barriers or aids between Black, Indigenous, and People of Color (BIPOC) students and White students.
Method:
The Communication Sciences and Disorders – Diversity, Equity, and Inclusion (DEI) Survey participants were 62 speech-language pathology and audiology undergraduate and graduate students from a variety of backgrounds. Analyses identified students’ views toward barriers and aids to success in the university program as well as their feelings regarding the importance of support from fellow students and faculty toward issues related to DEI.
Results:
In this group of students, BIPOC students were more likely to regard faculty and peer support toward DEI as “very important” than their White counterparts. White students were more likely to report that they had no barriers to success in their program than BIPOC students. Students from both White and BIPOC groups reported that scholarships would be an aid to success in the program, while roughly half of all students reported that having to work while in school was a barrier to success.
Conclusions:
Both BIPOC and White students identified barriers and aids to success in their programs of study, although differences between the types of aids and successes between racial groups were noted. This information may assist university programs in recruiting and supporting BIPOC students, although additional research on a larger scale of students from a variety of different programs may determine specific ways to support these groups.
Introduction
Diversity in Healthcare
Calls for improved diversity and cultural competence in healthcare have existed for many years. More recently, societal issues such as the COVID-19 pandemic, and efforts to impact social policies that negatively impact marginalized groups have given renewed focus to these efforts. Previous strategies have included increasing cultural competence training for current clinicians and strategies to attract qualified members of underrepresented groups to healthcare professions. However, an analysis of data from the 2019 American Community Survey (ACS) and the Integrated Postsecondary Education Data System (IPEDS) revealed that minorities remained underrepresented in 10 health care professions that were analyzed (Salsberg et al., 2021). These findings agree with previous data that found that African Americans, Hispanic Americans, and Native Americans make up 9% of nurses, 6% of physicians, and 5% of dentists, while making up 25% of the overall population (Sullivan Commission, 2003).
Diversity in healthcare goes beyond providing health care services to underserved populations. Recent literature has suggested that diverse teams lead to better outcomes for patients (Gomez & Bernet, 2019) and a diverse healthcare workforce can help shape research agendas (Cohen et al., 2002). Professionals who had student body diversity in their educational institutions have been associated with better training in treating diverse groups (Saha et al., 2008). Financial benefits of diversity have been seen in business. A study of 171 companies found that companies with above-average diversity had 38% more revenue from innovative products and services (Lorenzo et al., 2017). A meta-analysis of over 100 studies found that the process of adapting to greater diversity stretches cognitive flexibility, making everyone on the team more creative and improving collective judgment. The study focused on highlighting diversity and disproportionality as it relates to race and ethnicity, but it should be noted that there are more underrepresented identities in medical fields. Medical professionals with disabilities and those who identify as LGBTQ+ remain underrepresented and oppressed (Abes & Wallace, 2018; Linley et al., 2016; Miller & Smith, 2021; Preston & Hoffman, 2015).
Diverse students training to become medical professionals also experience unique barriers to their education. The financial burden of higher education has risen astronomically in the last 20 years. According to a report from the Georgetown University Center on Education and the Workforce, between 1980 and 2019, the average price for college increased 169%. Beyond the cost of tuition, many BIPOC students must work to pay the bills, leaving them with high unmet financial needs, such as transportation, childcare, educational materials, and other living expenses.
Barriers for racial and ethnic minorities may start as early as kindergarten. BIPOC students are often placed into lower-tiered classrooms and special education programs based on subjective evaluations. Lower-tiered classrooms generally have fewer highly qualified science and math faculty, making it difficult for students to complete college-preparatory and prerequisites courses at the high school and college level. Many health profession training programs place a strong emphasis on high GPA and test scores. Standardized tests are weak predictors of academic success—and they are expensive—which puts BIPOC students from a lower socioeconomic status (SES) at a disadvantage (Sullivan Commission, 2003). BIPOC students report that they feel lonely and unacknowledged in academic and clinical settings. To increase diversity means that we must understand why BIPOC students are not choosing to enter the healthcare field. When BIPOC students do enroll in a 4-year college, they have additional challenges.
Diversity in Communication Sciences and Disorders
The American-Speech-Language-Hearing Association (ASHA) has been addressing the problem of underrepresentation of racial and ethnic minorities for more than 50 years. ASHA established the Office of Multicultural Affairs (OMA) in 1969 to address the needs and access to services for diverse people with disabilities and diverse clinicians (Fannin, 2020). ASHA’s Strategic Pathway, which includes nine strategic objectives that must be executed in order to be a successful organization, specifically addresses increasing diversity, equity, and inclusion (DEI) within the association and the discipline (Strategic Objective 6). Although ASHA has had these initiatives, there is no empirical evidence to support that they have resulted in the desired outcomes of increased diversity among communication sciences and disorders (CSD) students and professionals (Richburg, 2022).
Annual demographic data from ASHA (2021) indicates that the race and ethnicities of its providers do not mirror the demographics of the overall population. The percentage of Black and Hispanic ASHA members is 3.1% and 5.3%, respectively, while the overall population percentages are 13.4 for Black Americans and 18.5 for those with Hispanic ethnicity (Mohapatra & Mohan, 2021). It is more crucial than ever to increase diversity in CSD because of the growing rise of BIPOC individuals in the U.S. In order to appropriately serve a diverse client population, a diverse workforce is required, which requires academic programs that recruit, support, and train students from racially and ethnically diverse backgrounds (Luedke, 2017).
Likewise, demographic data from the U.S. Census (2020) shows that Non-Hispanic White children (4.3%) had a lower disability rate than other racial groups. Conversely, BIPOC children have a higher rate of disability than Non-Hispanic White children, specifically 5.9% of American Indian and Alaska Native children have a disability. Children representing more than one race (5.2%) and Black children (5.1%) represent the next highest rate of disability in childhood. These statistics are contrary to the overwhelmingly Non-Hispanic White individuals who comprise the CSD profession, making it unlikely for diverse clients to have their race or ethnicity represented in their clinician.
Communication Sciences and Disorders Faculty Diversity
Just as there is disparity of minority representation in the healthcare industry and our own professions, BIPOC individuals are underrepresented among the faculty at universities. In one study by The Chronicle of Higher Education, White faculty comprise 75% of full-time faculty at 4-year institutions of higher education (Meyers, 2016). Conversely, BIPOC individuals represent 23.8% of more than 800,000 faculty at postsecondary institutions in the U.S. (National Center for Education Statistics, 2018). In the higher education allied health programs, BIPOC individuals comprise 15.9% of their nurse educators and 14% of full-time psychology faculty. Regarding CSD, the proportion of White and BIPOC faculty members is similar. In fact, White PhD-level faculty members account for 85% of all faculty working at universities, the combined percentage for all BIPOC faculty members is 15% (c.f. ASHA, 2019a; Horton et al., 2021).
Factors that appear to affect recruitment and retention of BIPOC faculty include job satisfaction, specifically intrinsic and extrinsic factors. Intrinsic factors relate to the individual skills/abilities necessary for carrying out the role of the position (O’Meara et al., 2019; Pace et al., 2019). Extrinsic factors relate to the environment of the workplace and job climate (Marston & Brunetti, 2009).
Communication Sciences and Disorders Student Diversity
From 2000 to 2010, according to statistics from the 2020 Census (Richburg, 2022), the minority population in the U.S. has risen from 34% to 43%. However, the number and diversity of minority students in universities has not kept pace with the rise of minorities in the overall population. The problem is not just in recruitment of BIPOC students, but also retention of these students to graduation. The rates of graduation for first-time, full-time undergraduate students at a 4-year university or college (National Center for Education Statistics, 2019) are: White students (64%), Black students (40%), American Indian/Alaskan Native (39%), Pacific Islander students (51%), Asian students (74%), Hispanic or Latino students (54%), and multiracial students (60%).
The educational programs for audiology and speech-language pathology appear to reflect the same lack of ethnic diversity as in the overall higher education population. So much so that White females make up the majority of students enrolled in these programs. Wilbur et al. (2020) refers to both fields as being some with the highest proportion of White professionals. A CSD Education survey collected data from 92% of the undergraduate and graduate programs in the U.S. Data from the survey found that racial/ethnic minority students comprised the following categories: 27.8% of undergraduates, 13.0% of clinical doctoral degrees in audiology, 17.2% of master’s degrees in speech-language pathology, and 15.2% of research doctoral degrees (CAPCSD & ASHA, 2022). Furthermore, these low percentages do not accurately reflect the number of individuals who go on to practice audiology or speech-language pathology in professional settings because of factors such as not pursuing a master’s or doctorate degree, not completing requirements for their Certificate of Clinical Competency, or not remaining in the U.S. to pursue their profession (Richburg, 2022).
Like many universities, the University of Central Arkansas (UCA) reflects the same disproportionality of BIPOC representation in the CSD student body. The overall university diversity distribution, as classified by the UCA Minority Recruitment and Retention Report, shows that BIPOC students represent 27% of the entire student body (UCA, 2020). However, in the past 5 years, BIPOC students only make up on average 11% of seniors and graduate students in the CSD department.
Many factors contribute to the recruitment and retention rates of minority students such as lack of appropriate academic preparation, inadequate study skills, lack of family guidance and support, and lack of role models who mirror their ethnic background. Additionally, a lack of mentors, limited financial resources to cover college costs and/or costs of living, low self-esteem, low social expectations for going to college and completing a college degree, inadequate financial aid information or knowledge of how to apply for aid, and admission policies that benefit White and affluent applicants also contribute to low recruitment and retention of BIPOC students (c.f. Richburg, 2022). Another factor that has been cited is CSD students experiencing microaggressions in their academic programs (Abdelaziz et al., 2021). Microaggressions are verbal or nonverbal indirect, subtle unintentional insults or acts of discrimination (Sue et al., 2007).
Rationale
The demographic profile of our profession is predominantly White females and does not reflect the diversity of the overall population in the U.S. (ASHA, 2021). In order to provide realistic and equitable treatment to the growing diversity of the U.S. population, our field needs to increase and broaden the diversity among faculty, students, and practicing speech-language pathologists. Furthermore, our field struggles with the increased demand for doctoral-level faculty (ASHA, 2022). As Ph.D. faculty retire, there is not a sufficient number of candidates to replace them, either White or BIPOC individuals. As Horton et al. (2021) note “research and reports regarding pipeline shortages have rarely considered the experiences and perspectives of underrepresented and minoritized racial/ethnic groups” (Horton et al., 2021, p 1228).
Diversity education and training in CSD programs at the university level needs a two-prong approach: (1) address the cultural awareness, cultural responsivity, and cultural knowledge among White students (Taliancich-Klinger et al., 2022); and (2) identify and address the challenges and barriers faced by BIPOC students (Mahendrta & Kashinath, 2022). It is a systematic problem at the university level that CSD students are not trained in culturally responsive care and, therefore, are not equipped to care for the growing number of BIPOC clients. Besides increasing diversity in our field, we also need to educate students about how to work with the BIPOC population, which includes English and non-English speaking individuals. The purpose of this study was to explore the second prong of this widespread DEI problem facing our profession. Our research questions were as follows.
- Is there a difference between level of important on DEI factors for BIPOC students when compared to White students?
- Is there a difference in the perceived barriers to student success experienced by BIPOC and White students?
- Is there a difference between BIPOC and White students in perceived solutions/ mechanisms that can aid in alleviating the barriers to being successful in school?
Method
Participants
Sixty-two undergraduate and graduate students participated in an 11-question survey that was designed to determine the participants’ feelings of DEI regarding the CSD department at the UCA. Participants received an anonymous survey through email distribution. It was created and distributed with approval from the UCA Institutional Review Board (IRB #21-037).
Of the 62 undergraduate and graduate respondents, 88.7% (n = 55) identified as female, 6.5% (n = 4) identified as non-binary, and 4.8% (n = 3) identified as male. Participants had the option to choose more than one racial category. Non-Hispanic White students made up the largest population of participants (n = 44; 77.2%). Black/African American students made up the next largest population at 9.8% (n = 6). Following this were American Native/Alaskan Native (n = 2; 3.3%), Hispanic/Latino (n = 2; 3.3%); and Asian (n = 2; 3.3%). One student identified as Hawaiian/Pacific Islander (1.6%) and one preferred not to say (1.6%). Three students (4.9%) selected the “other” category and listed “White” when prompted to define “other.” A more detailed description of these data is presented in Table 1. Because this was a pilot study, some variables (i.e., class designation, disability status, and age) were not measured in this survey.
| Demographic Area | Number of participants (n = 62) | Percentage of study participants |
|---|---|---|
| Gender | ||
| Male | 3 | 4.8 |
| Female | 55 | 88.7 |
| Nonbinary | 4 | 6.5 |
| Race and Ethnicity | ||
| American Native/Alaskan Native | 2 | 3.3 |
| Hispanic/Latino | 2 | 3.3 |
| Black/African American | 6 | 9.8 |
| Non-Hispanic White | 44 | 72.1 |
| Asian | 2 | 3.3 |
| Hawaiian/Pacific Islander | 1 | 1.6 |
| Prefer not to say | 1 | 1.6 |
| Other | 3 | 4.9 |
Survey Development
The CSD Diversity, Equity, and Inclusion Survey was designed and developed in stages using a modified version of the Artino et al. (2014) recommended processes for questionnaire development. The survey was developed and validated through five steps of this process: (1) Conducting a literature review, (2) conducting interviews with a focus group, (3) synthesizing the literature review and the focus group, (4) developing the survey items, and (5) conducting expert validation.
Step 1
The preliminary step to the survey development was conducting a literature review to assess existing data in the area and to find relevant or adaptable information. This step was performed by a small group of BIPOC students to be known as the study “focus group” for the remainder of this manuscript. The focus group found that students from underrepresented backgrounds in allied health professions often experienced microaggressions from their faculty members and fellow classmates (Abdelaziz et al., 2021; Bonifacio et al., 2018; Morales, 2014; Nadal et al., 2014). Abdelaziz et al. specifically investigated microaggressions in CSD programs and found that 64.5% of underrepresented students experienced microaggressions.
Step 2
The current study’s focus group intended to investigate similar information from the CSD program at the UCA, meaning that the target audience for this survey was undergraduate and graduate students in the CSD program at the UCA. The focus group conducted informal interviews with a variety of other underrepresented students about their happenings with faculty and other classmates to attempt to identify any anecdotal trends in their experiences. Data collected during this step uncovered the need to (1) assess what kind of barriers students face in graduate school, (2) investigate possible aids to those barriers, and (3) describe the importance of issues related to DEI as reported by students from different backgrounds.
Step 3
At this point, the audience and topic for the survey had been shaped, but the literature needed to be synthesized in order for the survey to ensure that the concept and questions made theoretical sense to every level of participant. This required the focus group to work with a group of faculty mentors to review and edit each piece of survey information. Although disability status and neurodivergence were not variables measured in this study, the focus group and group of faculty mentors developed each item to ensure accessibility and inclusion in the survey.
Step 4
The goal for the fourth step was the development of the specific questions. The survey consisted of 11 questions written to get a very generalized idea of how students perceived issues related to DEI. Because this study acted as a pilot study, having a short and easily accessible survey was essential. Survey items included questions about basic demographic information, as well as identifying roadblocks to success in getting a degree in speech-language pathology and identifying aids in overcoming roadblocks. Using a Likert scale, participants were asked to rank how important DEI was to them individually, as well as how important it was for their faculty and classmates to value them. A score of 0 indicated that these were not important, where a score of 5 indicated that these are very important.
Step 5
After the questionnaire items had been developed, survey validity was assessed using a group of content experts to ensure that each item was relevant and appropriate. In this case, the content experts were faculty members and students with lived experience. This step also included the bulk of editing each item based on written feedback given by the content experts.
Data Analysis
A Google Form was used as the survey platform by which the data were collected. Descriptive statistics were used to summarize the background of the participants; students’ ratings for level of importance of DEI issues as they relate to personal opinion, classmate opinions, and faculty opinions; roadblocks to educational success experienced by students; and types of aids that might assist with the aforementioned roadblocks. The collected data regarding all items except for demographic items were analyzed according to the entire participant population and then according to specific racial backgrounds of students in order to identify trends and themes.
Results
Our first research question examined the importance of DEI to BIPOC students as compared to White students. To answer this question, we examined the participants’ value of DEI, as well as the importance of these values to their faculty and classmates.
Individual Importance
When asked how important DEI was to individual participants, 10 BIPOC participants (83%) selected a “5” on the Likert scale, as opposed to 28 White participants (60%). One BIPOC participant (8%) and 12 White participants (26%) selected “4.” Finally, one BIPOC participant (8%) and 7 White participants (15%) selected a “3.” This information is shown in Figure 1.
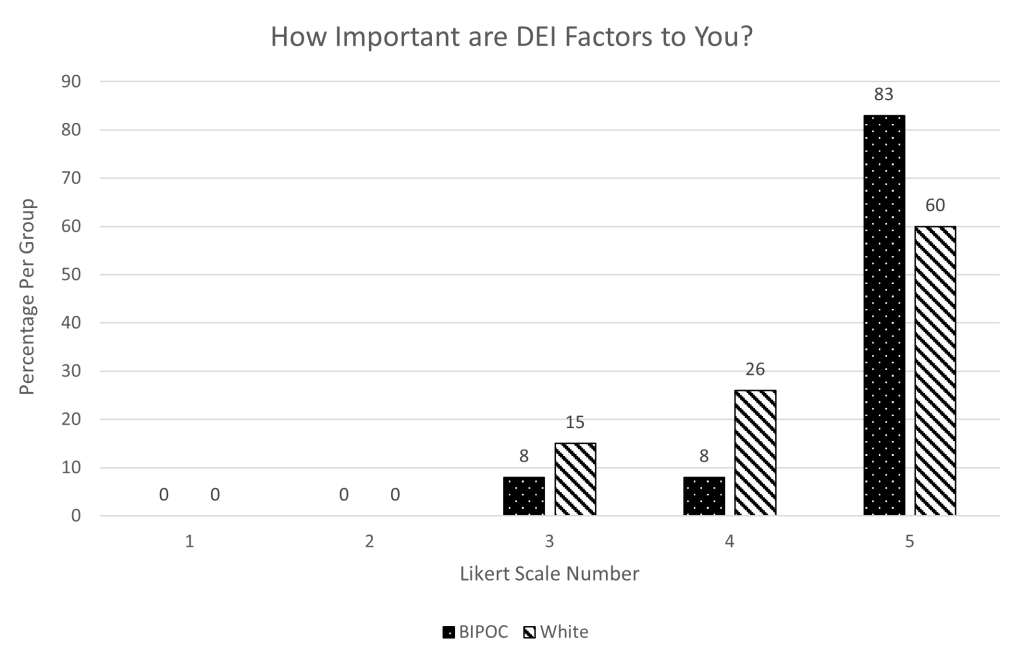
This information was further analyzed to differentiate answers per racial group. One American Native/Alaskan Native student indicated this importance factor as a “3” on the Likert scale, one Asian American student selected “4” on the Likert scale, while every other BIPOC student indicated that these factors were very important by selecting “5” on the Likert scale (Black/African American: n = 6, 100%; Hispanic: n = 2, 100%; American Native/Alaskan Native: n = 1, 50%; Asian: n = 1, 50%).
Faculty Importance
When asked how important it is that faculty members value DEI, 11 BIPOC participants (92%) selected a “5” on the Likert scale, as opposed to 32 White participants (68%). Ten White participants (21%) selected “4” and five White participants (11%) selected “3.” One BIPOC student (8%) selected “2.” This information is shown in Figure 2.
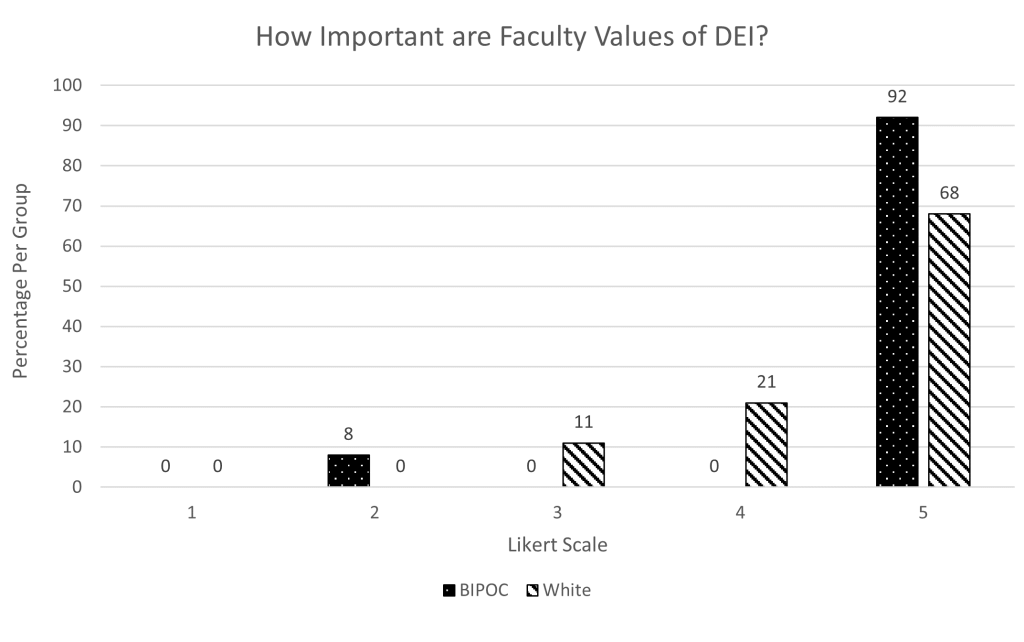
This information was further analyzed to differentiate answers per racial group. One American Native/Alaskan Native student indicated this importance factor as a “2” on the Likert scale, while every other BIPOC student indicated that it was very important that their faculty members value these factors by selecting “5” on the Likert scale (Black/African American: n = 6, 100%; Hispanic: n = 2, 100%; American Native/Alaskan Native: n = 1, 50%; Asian: n = 2, 100%).
Classmate Importance
When asked how important it is that participants’ classmates value DEI, 11 BIPOC participants (92%) selected a “5” on the Likert scale, as opposed to 29 White participants (62%). Eleven White participants (23%) selected “4,” six White participants (13%) selected a “3,” and one White student (2%) selected “2.” One BIPOC student (8%) also selected “2.” This information is shown in Figure 3.
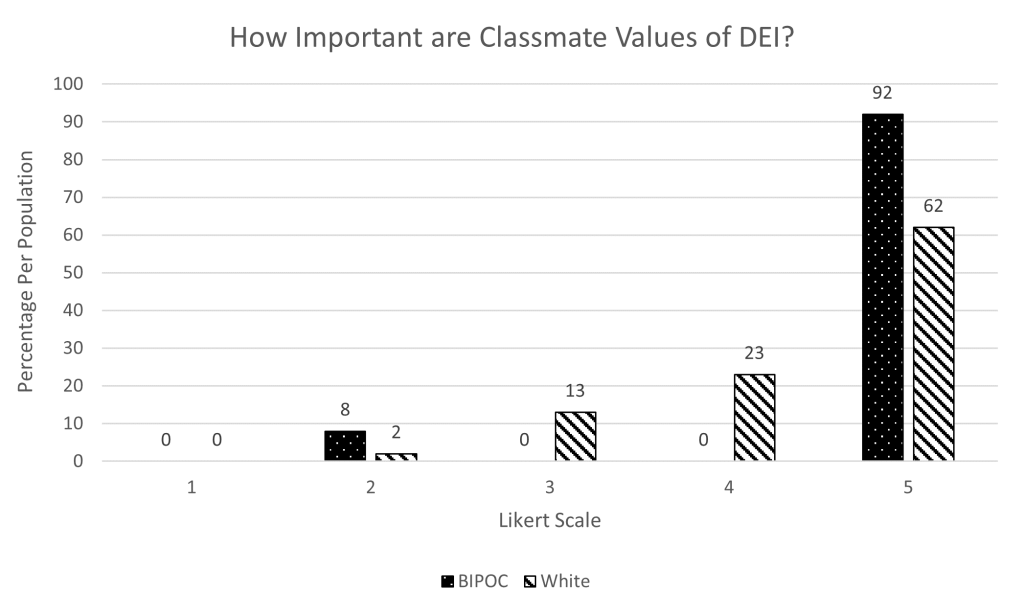
This information was further analyzed to differentiate answers per racial group. One American Native/Alaskan Native student indicated this importance factor as a “2” on the Likert scale, while every other BIPOC student indicated that it was very important that their faculty members value these factors by selecting “5” on the Likert scale (Black/African American: n = 6, 100%; Hispanic: n = 2, 100%; American Native/Alaskan Native: n = 1, 50%; Asian: n = 2, 100%).
Barriers to Success in CSD Program
Our second question compared BIPOC and White students’ perceived barriers to student success in the CSD program. To answer this question, participants were asked to select the following barriers that they experienced in school.
- I have important duties linked to my family (house sitting, taking care of a family member, having a child, or other.)
- I must work while attending school to pay for my education and other necessities (insurance, food, rent, or others)
- I do not have a mode of transportation.
- I do not feel comfortable because of my culture, race, sexual orientation, gender, or etc.
- The lack of cultural diversity within my classrooms, club activities, and faculty.
- I am studying far away from home. (International, out-of-state, etc.)
- None
Participants had the option to choose as many items as were applicable. Detailed data about the participant population is shown in Figure 4.
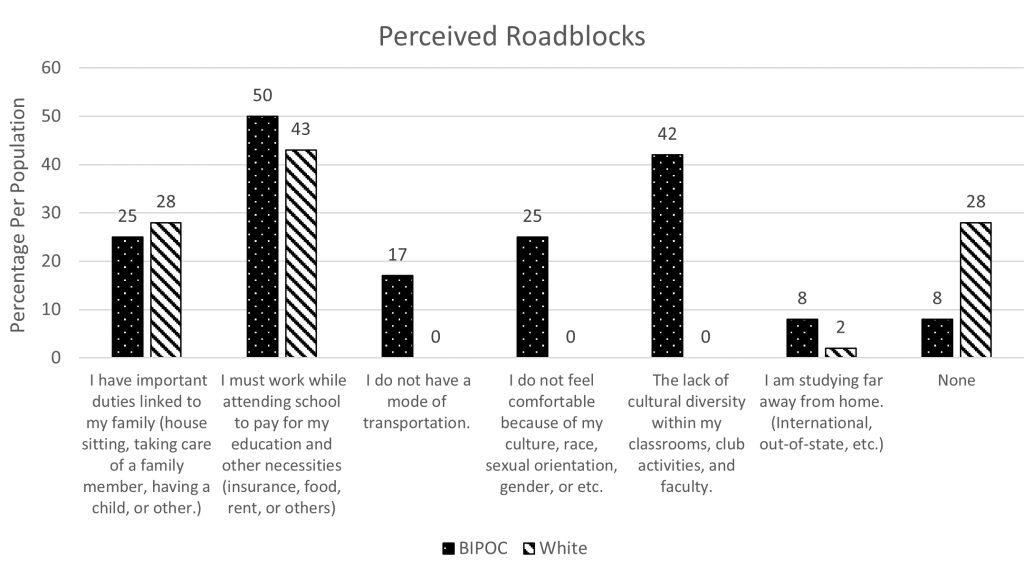
BIPOC students identified a variety of barriers. These included: (1) having important duties linked to family (n = 3; 25%), (2) having to work during school (n = 6; 50%), (3) not having transportation (n = 2; 17%), (4) not feeling comfortable because of their race, sexual orientation, gender, etc. (n = 3; 25%), (5) the lack of cultural diversity within various aspects of school life (n = 5; 42%), (6) studying far from home (n = 1, 8%), and (7) None (n = 1; 8%).
Further analysis revealed that American Native/Alaskan Native students reported three barriers: (1) having important duties linked to family (n = 1; 50%), (2) having to work during school (n = 1; 50%), and (3) None (n = 1; 50%). Hispanic/Latino students also reported three barriers: (1) having important duties linked to family (n = 2; 100%), (2) having to work during school (n = 2; 100%), and (3) the lack of cultural diversity within various aspects of school life (n = 2; 100%). Black/African American students identified five barriers to success in school: (1) having to work during school (n = 3; 50%); (2) not having transportation (n = 1; 17%); (3) not feeling comfortable because of their culture, race, sexual orientation, gender, etc. (n = 3; 50%); (4) the lack of cultural diversity within various aspects of school life (n = 4; 67%); and (5) studying far from home (n = 1; 17%). Asian students identified two barriers: (1) not having transportation (n = 1; 50%) and (2) the lack of cultural diversity within various aspects of school life (n = 1; 50%).
White students also identified a variety of barriers to success in school, although they were much less related to culture and diversity as they were related to other aspects of life. They identified the following barriers: (1) having important duties linked to family (n = 12; 28%), (2) having to work during school (n = 24; 55%), (3) studying far from home (n = 3; 9%), and “None” (n = 12; 28%). One White student (2%) chose not feeling comfortable because of race, ethnicity, sexual orientation, gender, etc. as a barrier and one White student (2%) chose the lack of cultural diversity in aspects of school life as a barrier.
This information was then analyzed using a risk ratio analysis to further compare BIPOC students to their White counterparts. BIPOC students were 14.5 times more likely to consider the lack of diversity a barrier than White students. Alternatively, White students were 11.5 times more likely to identify “no” barriers when compared to their BIPOC counterparts.
Aids for Success in CSD Program
Our third questions compared BIPOC and White students’ perceived aids to student success in the CSD program. To answer this question, participants were asked to select the following perceived aids that would assist them with being successful in school.
- A good support system from your family (financial management, moral support, etc.).
- A welcoming and understanding faculty member.
- Scholarships and financial aid
- Friendships established within my undergraduate or graduate program.
- Access to physical and mental wellness services
Participants had the option to choose as many items as were applicable. Detailed data about the participant population as a whole can be found in Figure 5.
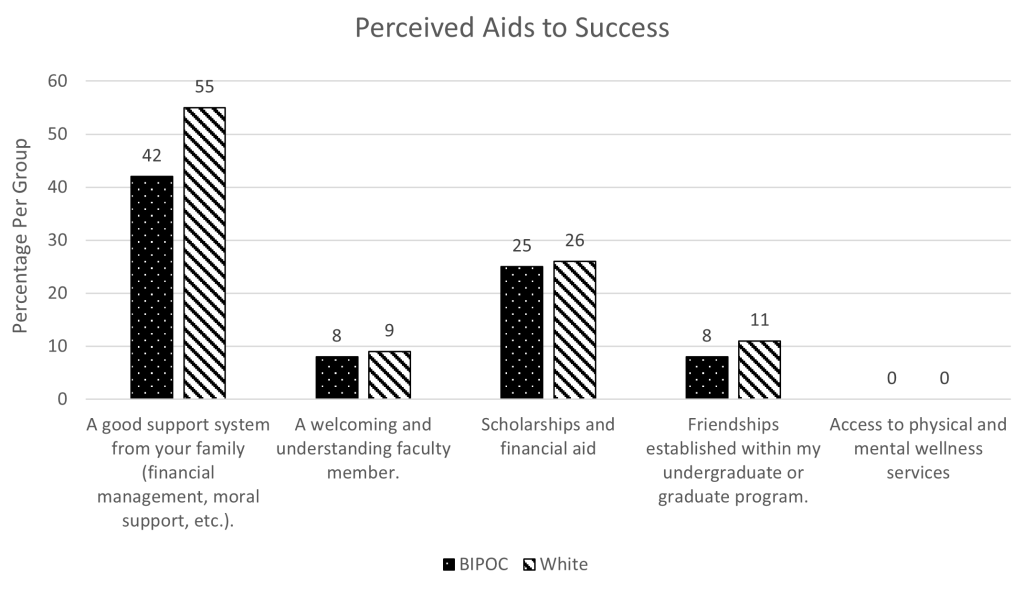
BIPOC students identified a variety of aids that would assist them during school. Five BIPOC participants (42%) reported that a good support system from family would be most helpful. One BIPOC student (8%) reported that a welcoming and understanding faculty member would be most helpful. Four BIPOC students (25%) suggested that scholarships and financial aid would be most helpful. Finally, one BIPOC student (8%) reported that friendships were most important.
Further analysis showed that American Native/Alaskan Native students reported that a good support system from family would be most helpful (n = 2; 100%). Hispanic/Latino students also reported one aid, which is having access to scholarships and financial aid (n = 2; 100%). Black/African American students identified three aids to success in school: (1) having a good support system from their family (n = 2; 33%), (2) a welcoming and understanding faculty member (n = 1; 17%), and (3) scholarships and financial aid (n = 2; 33%). Asian students also identified three aids: (1) having a good support system from their family (n = 1; 50%), (2) friendships established within the program of study (n = 1; 50%), and (3) access to physical and mental wellness services (n = 1; 50%).
White students had the most varied selection of aids to success in school. They identified the following aids: (1) having a good support system from their family (n = 26, 55%), (2) a welcoming and understanding faculty member (n = 4, 9%), (3) scholarships and financial aid (n = 12, 26%), and (4) friendships established within the program (n = 5, 11%).
Additionally, a risk ratio was conducted to assess any discrepancies among racial groups. Results indicated that Black students were twice as likely to find a welcoming and understanding faculty member as an aid than White students.
Discussion
This study aimed to identify the challenges and barriers faced by BIPOC students studying communication sciences and disorders. Our study found similar barriers that have been previously mentioned by other researchers, such as having family and work responsibilities, transportation issues, and a lack of understanding of cultural diversity in fellow students and faculty. White students also identified barriers to success in school, but they were generally not related to DEI. Only one White student who responded to the survey chose “lack of diversity” as a barrier to their education.
One notable finding was the response from students regarding their preference on how important DEI are to their classmates and faculty members. While more BIPOC students rated their preference as “very important,” a majority of all students (67.2% for classmates and 72.1% for faculty) indicated that the value their classmates and faculty held regarding diversity was very important. This finding could indicate that White students are becoming more cognizant of this issue in our profession and may ultimately seek training programs that value diversity in its many forms.
Faculty may not realize how their views on diversity, or silence on the issue, affects BIPOC students. While half of all students rated this as very important, 100% of Black, Hispanic, and Asian students reported this as very important. Educating faculty in CSD programs is going to be critical for addressing the lack of diversity in our field. Educating faculty will include more than awareness of the problem, but actually providing resources that faculty will find useful in their teaching and mentoring of students. Future studies could also include open response questions to investigate how DEI training for faculty would help BIPOC students.
The financial barrier to higher education seemed to exist for all races. Approximately half of all Black and White students who responded reported “having to work” as a barrier. Future research should focus on the number of hours worked and how students are paying for college (scholarships, grants, student loans, out of pocket, etc.) to further delineate how working is a barrier to success. We know that college tuition is rising nationwide and understanding how BIPOC students are meeting the challenge of rising costs may lead to solutions for particular student groups.
Our healthcare system in the U.S. has been attempting to address the lack of diversity and cultural competence for many years. We now have data that healthcare outcomes can be improved by providing culturally competent care. Perhaps the best way to do that is to ensure that the healthcare workforce mirrors the general population that they treat. Obtaining student input is critical to our understanding of the problem. This issue may benefit from a multifaceted approach, with government, institutions, educational programs, and professional accreditation bodies each playing a role in efforts to remove barriers to diversity, equity, and inclusion in health care.
Limitations
This study was conducted as a pilot study, which resulted in a small participant pool from one university. Although the participant pool was less diverse than the overall population of the U.S., it was reflective of the diversity within ASHA members. This study gave us valuable information that may lead to future studies.
One possibility for future research would be to duplicate the current study with a wide variety of universities. This could allow researchers to get a broader understanding of the needs of BIPOC CSD students as a large population. Additionally, it would be useful to understand the needs of CSD students with disabilities and neurodivergence, as well as the needs of LGBTQ+ CSD students. This could uncover valuable ways to support and encourage all students, not just the majority. Future research could also include a similar survey for faculty—gaining information on faculty awareness of the barriers that BIPOC students. Information gained from a survey like this could then translate into future training programs that specifically target the needs of BIPOC students at individual universities. It is not only important to gain information on the awareness of DEI, but also the value in addressing it through cultural training. Because “culture” includes so many additional factors (e.g., neurodiversity, gender, disability, etc.), in addition to race or ethnicity, training in this area may make faculty members aware of how culture impacts students at the university level.
Conclusions
BIPOC students are the future of the CSD professional body. It is essential for universities and faculties to support them, which includes identifying unmet needs. This study indicates that there are some fundamental aids that can be utilized to help students work their way towards success in undergraduate and graduate school. Responses from students in this study suggests that educating faculty to be proactive, not reactive, or essentially silent, on issues of diversity is one step that can be taken immediately. Professional organizations, universities, and departments should prioritize funding for BIPOC students. For these students, family and work obligations were identified as a major barrier. Non-traditional avenues, such as part-time options, for education and training that meet the needs of all students will require implementation in order to attract and retain BIPOC students in the CSD profession.
References
Abdelaziz, M. M., Matthews, J. J., Campos, I., Kasambira Fannin, D., Rivera Perez, J. F., Wilhite, M., & Williams, R. M. (2021). Student stories: Microaggressions in communication sciences and disorders. American Journal of Speech-Language Pathology, 30(5), 1990-2002. https://doi.org/ 10.1044/2021_AJSLP-21-00030
Abes, E. S., & Wallace, M. M. (2018). “People see me, but they don’t see me”: An intersectional study of college students with physical disabilities. Journal of College Student Development, 59(5), 545-562. https://doi.org/10.1353/csd.2018.0052
American Speech-Language-Hearing Association. (2021). Profile of ASHA members and affiliates with Ph.Ds. https://www.asha.org/siteassets/surveys/2021-phd-holders.pdf
American Speech-Language-Hearing Association. (2022). 2021 Member and affiliate profile. https://www.asha.org/siteassets/surveys/2021-member-affiliate-profile.pdf
Artino A. R., Jr., La Rochelle, J. S., Dezee, K. J., & Gehlbach, H. (2014). Developing questionnaires for educational research: AMEE Guide No. 87. Medical Teacher, 36(6), 463-474. https://doi.org/ 10.3109/0142159X.2014.889814
Bonifacio, L., Gushue, G. V., & Mejia-Smith, B. X. (2018). Microaggressions and ethnic identity in the career development of Latina college students. The Counseling Psychologist, 46(4), 505-529. https://doi.org/10.1177/0011000018776909
Council of Academic Programs in Communication Sciences and Disorders & American Speech-Language Hearing Association. (2022). Communication sciences and disorders (CSD) education survey national aggregate data report: 2020–2021 academic year. https://www.asha.org/siteassets/ surveys/csd-education-survey-national-aggregate-data-report.pdf
Cohen, J. J., Gabriel, B. A., & Terrell, C. (2002) The case for diversity in the healthcare workforce. Health Affairs, 21(5), 90-102. https://doi.org/10.1377/hlthaff.21.5.90
Fannin, D. K. (2020). Celebrating the 50th anniversary of ASHA’s Office of Multicultural Affairs. Perspectives of the ASHA Special Interest Groups, 5(1), 1-2. https://doi.org/10.1044/ 2019_PERSP-19-00042
Gomez, L. E., & Bernet, P. (2019). Diversity improves performance and outcomes (2019). Journal of National Medical Association, 111(4), 383-392. https://doi.org/10.1016/j.jnma.2019.01.006
Horton, R., Munoz, M. L., & Johnson, V. E. (2021). Faculty of color, bulletproof souls, and their experiences in communication sciences and disorders. Perspectives of the ASHA Special Interest Groups, 6, 1227–1244. https://doi.org/10.1044/2021_PERSP-20-00170
Linley, J. L., Nguyen, D., Brazelton, G. B., Becker, B., Renn, K., & Woodford, M. (2016). Faculty as sources of support for LGBTQ college students. College Teaching, 64(2), 55-63. https://doi.org/10.1080/ 87567555.2015.1078275
Lorenzo, R., Voigt, N., Schetelig, K., Zawadzki, A., Welpe, I., & Brosi, P. (2017). The mix that matters: Innovation through diversity. The Boston Consulting Group, 26. https://www.bcg.com/ publications/2017/people-organization-leadership-talent-innovation-through-diversity-mix-that-matters
Luedke, C. L. (2017). Person first, student second: Staff and administrators of color supporting students of color authentically in higher education. Journal of College Student Development, 58(1), 37-52. https://doi.org/10.1353/csd.2017.0002
Mahendra, N., & Kashinath, S. (2022). Mentoring underrepresented students in speech-language pathology: Effects of didactic training, leadership development, and research engagement. American Journal of Speech-Language Pathology, 31(2), 527-538. https://doi.org/10.1044/ 2021_AJSLP-21-00018
Marston, S., & Brunetti, G. (2009). Job satisfaction of experienced professors at liberal arts college. Education, 130(2), 323–347.
Miller, R. A., & Smith, A. C. (2021). Microaggressions experienced by LGBTQ students with disabilities. Journal of Student Affairs Research and Practice, 58(5), 491-506. https://doi.org/10.1080/ 19496591.2020.1835669
Mohapatra, B., & Mahan, R. (2021). A proposed framework for increasing racial and ethnic diversity in communication sciences and disorders academic programs: The REAP model. Perspectives of the ASHA Special Interest Groups, 6, 755-767. https://doi.org/10.1044/2021_PERSP-20-00285
Morales, E. M. (2014). Intersectional Impact: Black students and race, gender and class microaggressions in higher education. Race, Gender & Class, 21(3/4), 48–66. http://www.jstor.org/stable/43496984
Meyers, B. (2016, February). Where are the minoritized professors? The Chronicle of Higher Education. https://www.chronicle.com/interactives/where-are-the-minoritized-professors
Nadal, K. L., Wong, Y., Griffin, K. E., Davidoff, K., & Sriken, J. (2014). The adverse impact of racial microaggressions on college students’ self-esteem. Journal of College Student Development, 55(5), 461-474. https://doi.org/10.1353/csd.2014.0051
National Center for Education Statistics. (2018). Digest of education statistics (Table 315.20). U.S. Department of Education. https://nces.ed.gov/programs/digest/d18/tables/dt18_315.20.asp
National Center for Education Statistics. (2019). Fast facts: Degrees conferred by race and sex. https://nces.ed.gov/fastfacts/display.asp?id=72
O’Meara, K. A., Lennartz, C. J., Kuvaeva, A., Jaeger, A., & Misra, J. (2019). Department conditions and practices associated with faculty workload satisfaction and perceptions of equity. The Journal of Higher Education, 90(5), 744–772. https://doi.org/10.1080/00221546.2019.1584025
Pace, F., D’Urso, G., Zappulla, C., & Pace, U. (2019). The relation between workload and personal well-being among university professors. Current Psychology, 1–8. https://doi.org/10.1007/s12144-019-00294-x
Preston, M. J., & Hoffman, G. D. (2015). Traditionally heterogendered institutions: Discourses surrounding LGBTQ college students. Journal of LGBT Youth, 12(1), 64-86. https://doi.org/10.1080/19361653. 2014.935550
Richburg, C. M. (2022). Underrepresentation of students from diverse backgrounds entering communication sciences and disorders programs: An investigation into the university student perspective. American Journal of Speech-Language Pathology (Online), 3(2), 613-630. https://doi:10.1044/202l_AJSLP-21-00010
Saha, S., Guiton, G., & Wimmers, P. (2008). Student body and ethnic composition and diversity-related outcomes in U.S. medical schools. Journal of the American Medical Association, 300(10), 1135-1145. https://doi:10.1001/jama.300.10.1135
Salsberg, E., Richwine, C., Westergaard, S,Portela, M., Oyeyemi, T., Vichare, A., & Chen, C. (2021). Estimation and comparison of current and future racial/ethnic representation in the U.S. health care workforce. Journal of the American Medical Association Network Open, 4(3) https://doi:10.1001/jamanetworkopen.2021.3789
Sue, D. W., Capodilupo, C. M., Torino, G. C., Bucceri, J. M., Holder, K., Nadal, K. L., & Esquilin, M. (2007). Racial microaggressions in everyday life: Implications for clinical practice. American Psychologist, 62(4), 271-286. https://doi.org/10.1037/0003-066x.62.4.271
Sullivan Commission. (2003). Missing persons: Minorities in the health professions. https://campaignfor action.org/resource/sullivan-report-diversity/
Taliancich-Klinger, C., Hernandez, N. A., & Maurer, A. (2022). Engaging graduate students in cultural experiences early: The development, implementation, and preliminary student perceptions of a community engagement clinical experience. American Journal of Speech-Language Pathology, 31(2), 539-551. https://doi.org/10.1044/2021_AJSLP-20-00335
U.S. Census Bureau (2020). 2020 census results. https://www.census.gov/topics/population/race/data/ tables.2020.List_523928342.html#list-tab-List_523928342
University of Central Arkansas. (2020). Minority recruitment and retention report with the 2019-2020 diversity report. https://uca.edu/about/files/2020/09/uca_mrrreport_2019-2020.pdf
Wilbur, K., Snyder, C., Essary, A., Reddy, S., Will, K., & Saxon, M. (2020). Developing workforce diversity in the health professions: A social justice perspective. Health Professions Education, 6(2), 222–229. https://doi.org/10.1016/j.hpe.2020.01.002626
