The Cardiac Cycle | Measuring and Managing the Output of the Heart
Objective 4
Define the steps in the cardiac cycle. Correlate the cardiac cycle with the electrocardiogram and with the pumping action of the heart. Explain how the output of the heart is measured. Interpret a graph of the pressure in different parts of the systemic circuit.
The Cardiac Cycle
The last objective concerned the electrical activity of the heart. We saw how the rhythmic electrical activity of the pacemakers, and of the cardiac muscle cells themselves, created an electrical wave spreading over the surface of the heart which is detected as the electrocardiogram (ECG or EKG) on the surface of the chest.
In this objective, we’ll see how this wave of electrical activity is translated into heart muscle contraction, and how that rhythmic contraction leads to the movement of blood within the heart and through the pulmonary and systemic circuits.
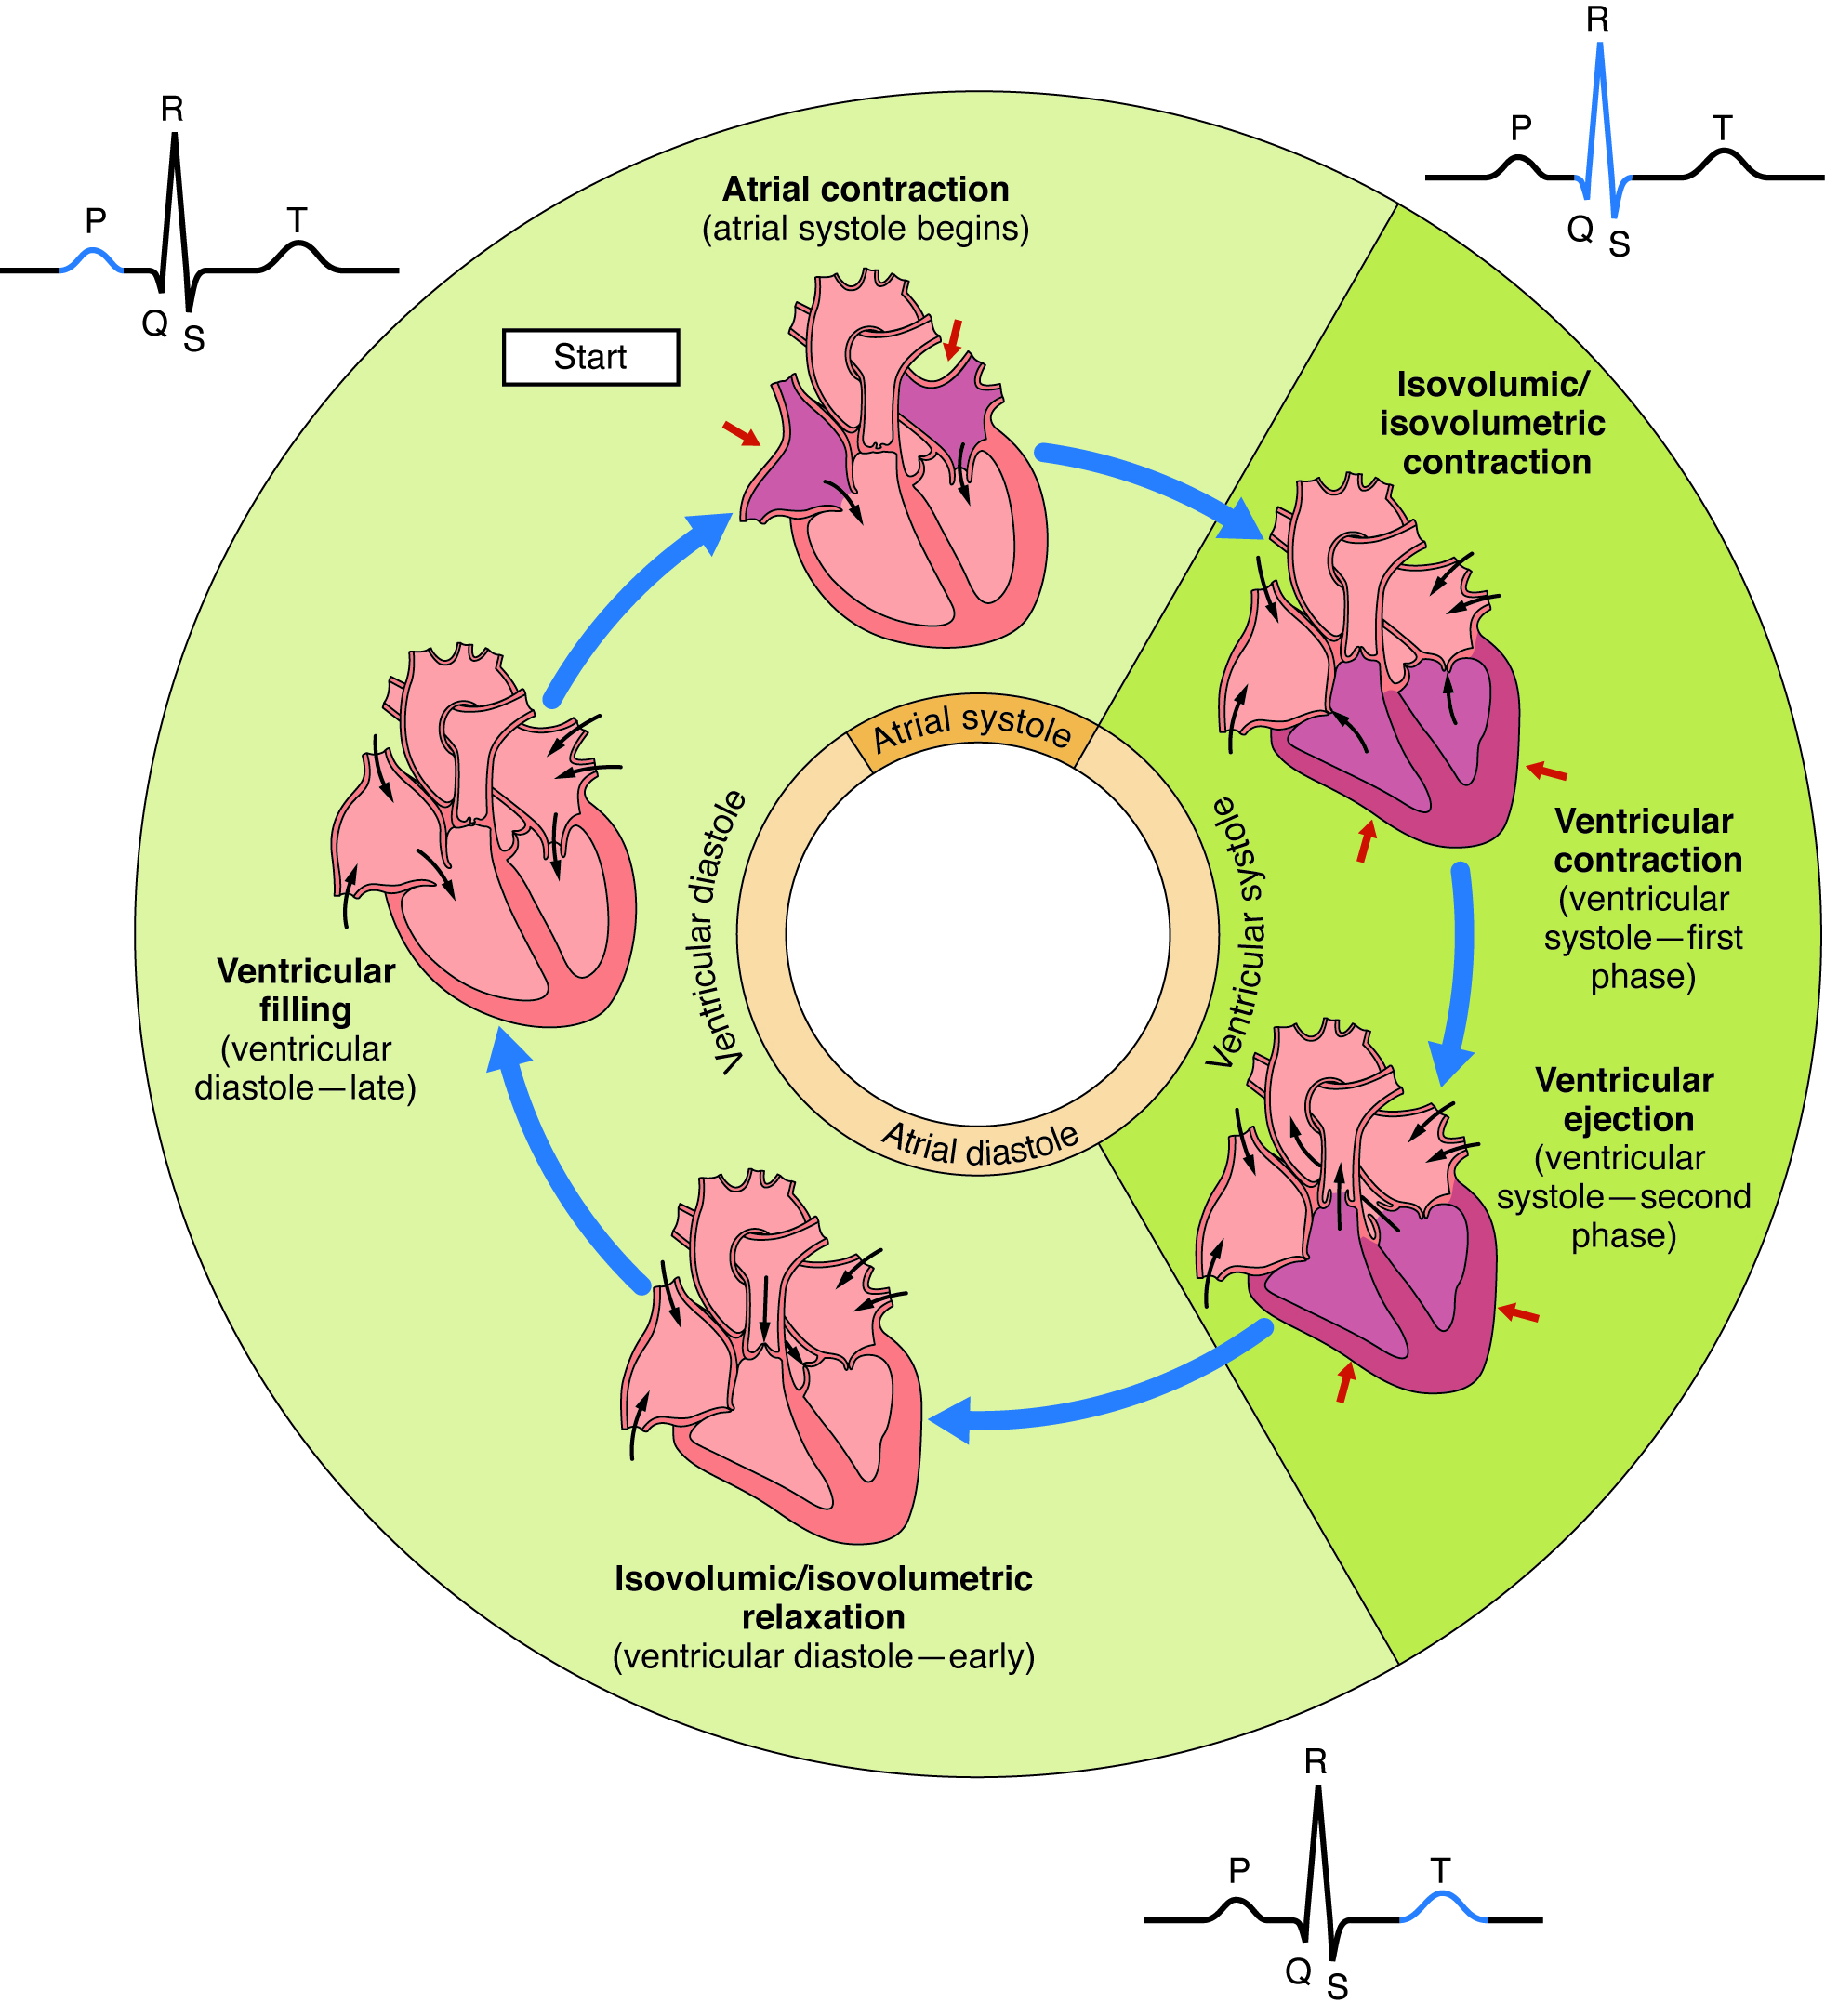
We’ll start our analysis of the diagram above at 12 o’clock on the clock face. Here, there is a wave of electrical activity spreading between the SA node and the AV node in the right atrium and over the surface of the left atrium. This wave of electrical activity causes both atria to contract simultaneously (the so-called “atrial kick“). Formally, this is called atrial systole. Note the darker gold color of the inner ring of the diagram. This is represented by the P wave on the ECG.
This is the only time the atria contract; the remainder of the time, they are relaxed (the lighter gold color of the inner ring). The relaxed state of the atria is called atrial diastole. Blood enters the atria during this relaxation phase, as shown by the small black arrows.
Now we switch to about 1 o’clock to 5 o’clock on the diagram. Here, the outer ring is a darker green color. This is ventricular systole. The electrical activity is now spreading through the AV bundle (bundle of HIs), into the bundle branches, and across the Purkinje cell network on the surface of the myocardium. At first, the ventricles contain the same volume of blood. This is called isovolumic or isovolumetric contraction. The contraction of the heart muscle against a relatively incompressible liquid medium increases its pressure, just as you can feel the pressure increase on a blocked syringe as you push on the plunger. The increase in pressure opens the outflow (semilunar) valves. Blood is pushed out of the heart through the pulmonary and aortic valves into the pulmonary trunk and the aorta, respectively. This is ventricular ejection. Electrically, ventricular systole corresponds to the QRS complex of the ECG.
The ventricles repolarize (i.e. the electrical potential of the myocardial cells goes back to –60 mV or so). As they do, the ventricles relax (ventricular diastole). At first, the volume of the remaining blood in the ventricles remains the same. This is called isovolumic or isovolumetric relaxation. Like pulling up on a plunger on a closed syringe, this will reduce the pressure of the blood remaining in the ventricles. The pressure in the atria is now greater than the pressure in the ventricles and the AV valves open. Blood moves from the right atrium through the tricuspid valve and into the right ventricle. Blood moves from the left atrium through the mitral valve and into the left ventricle. Electrically, ventricular diastole corresponds to the T wave of the ECG.
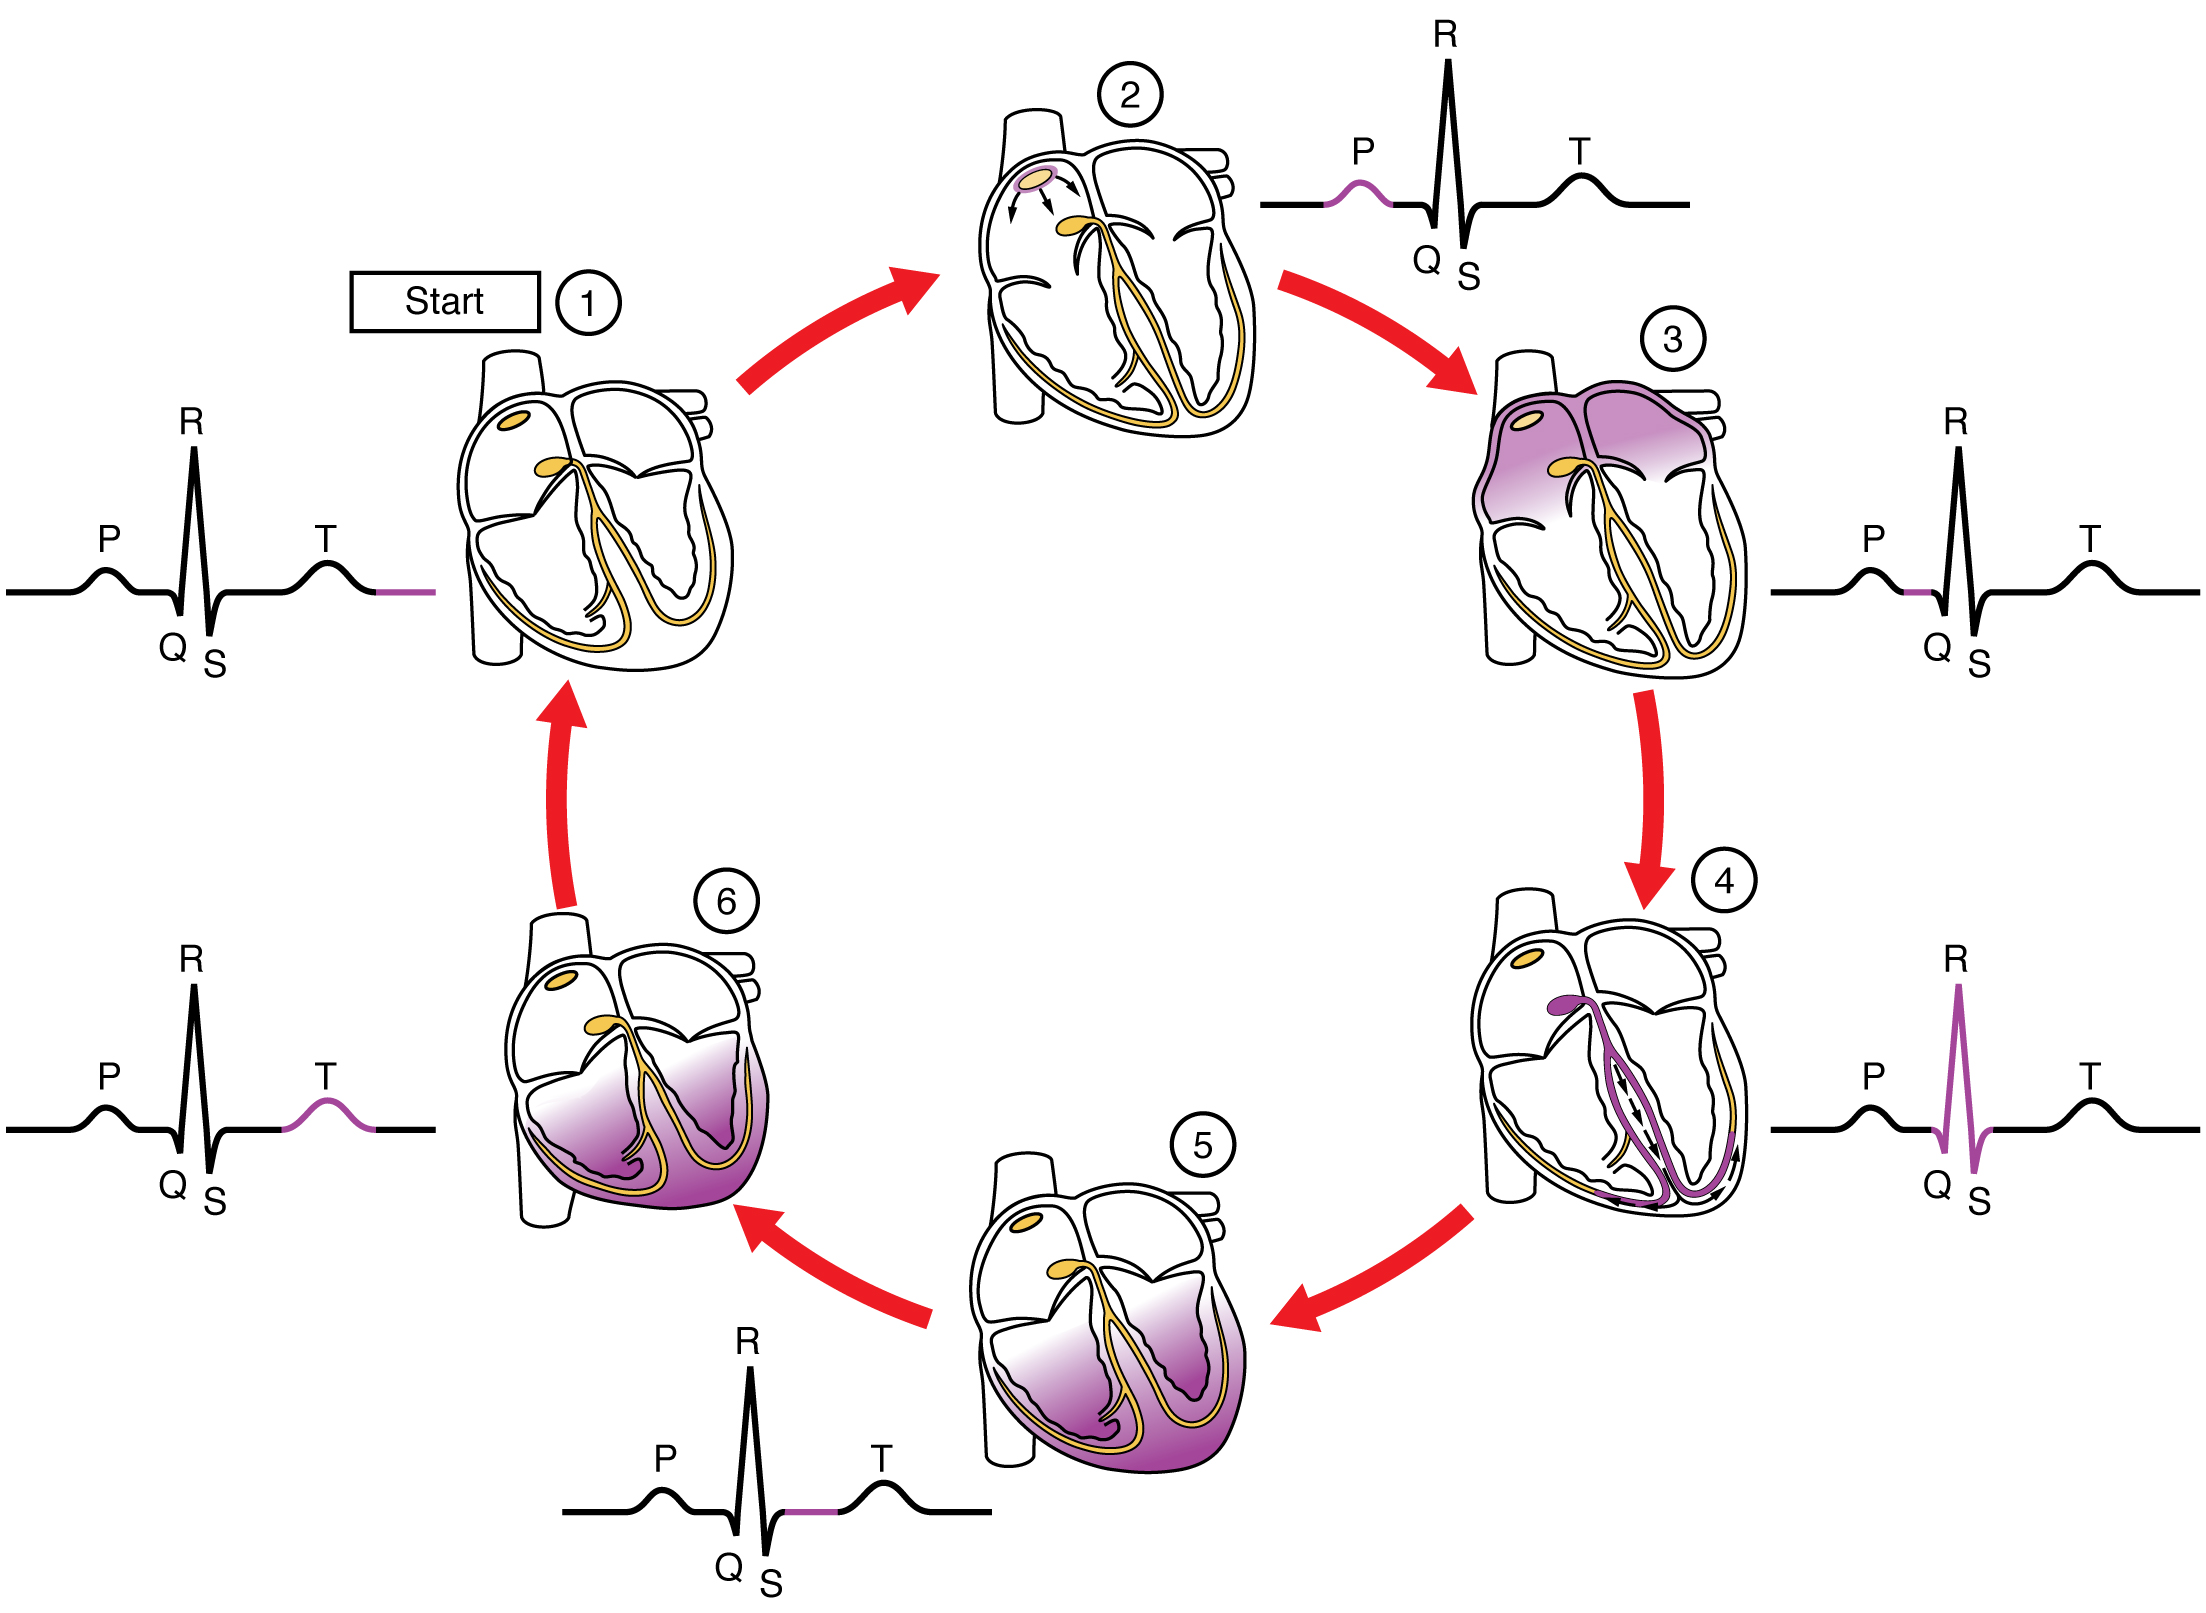 This diagram shows the series of events in the cardiac cycle, but now we are focused on the electrical activity alone. Here, depolarization of myocardial cells is represented by purple shading.
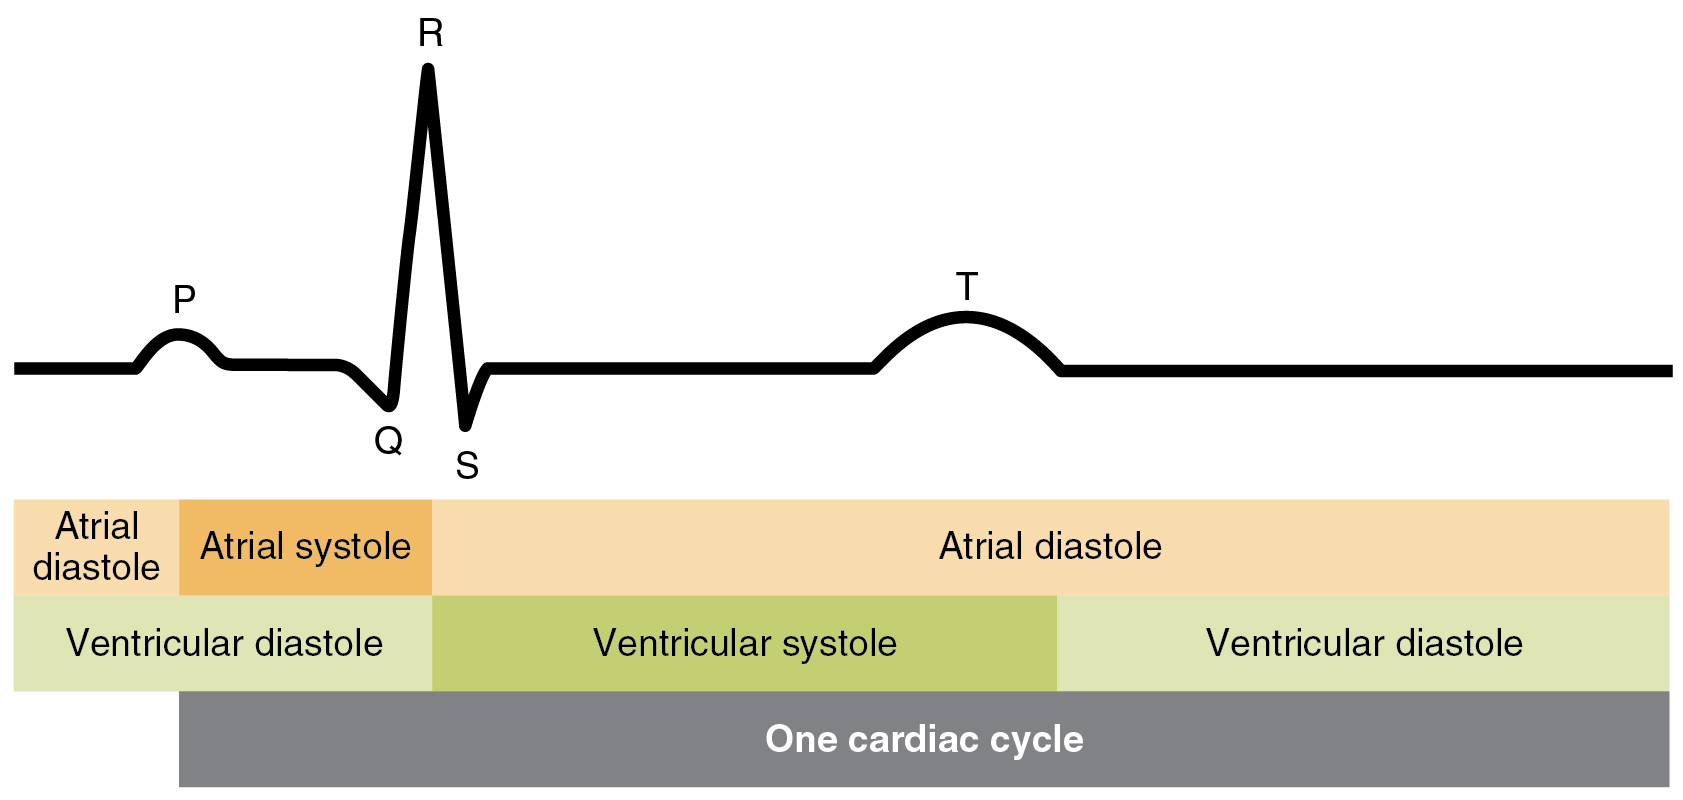 All this diagram does is to show the cycles of atrial systole and atrial diastole as bars instead of rings; the color code is the same. Darker colors represent systole and lighter colors represent diastole. Similarly, ventricular diastole and ventricular systole are represented as bars underneath the parts of the ECG. From the beginning of one P wave to the beginning of the next is one cardiac cycle.
Pressure Changes in the Heart Chambers During the Cardiac Cycle
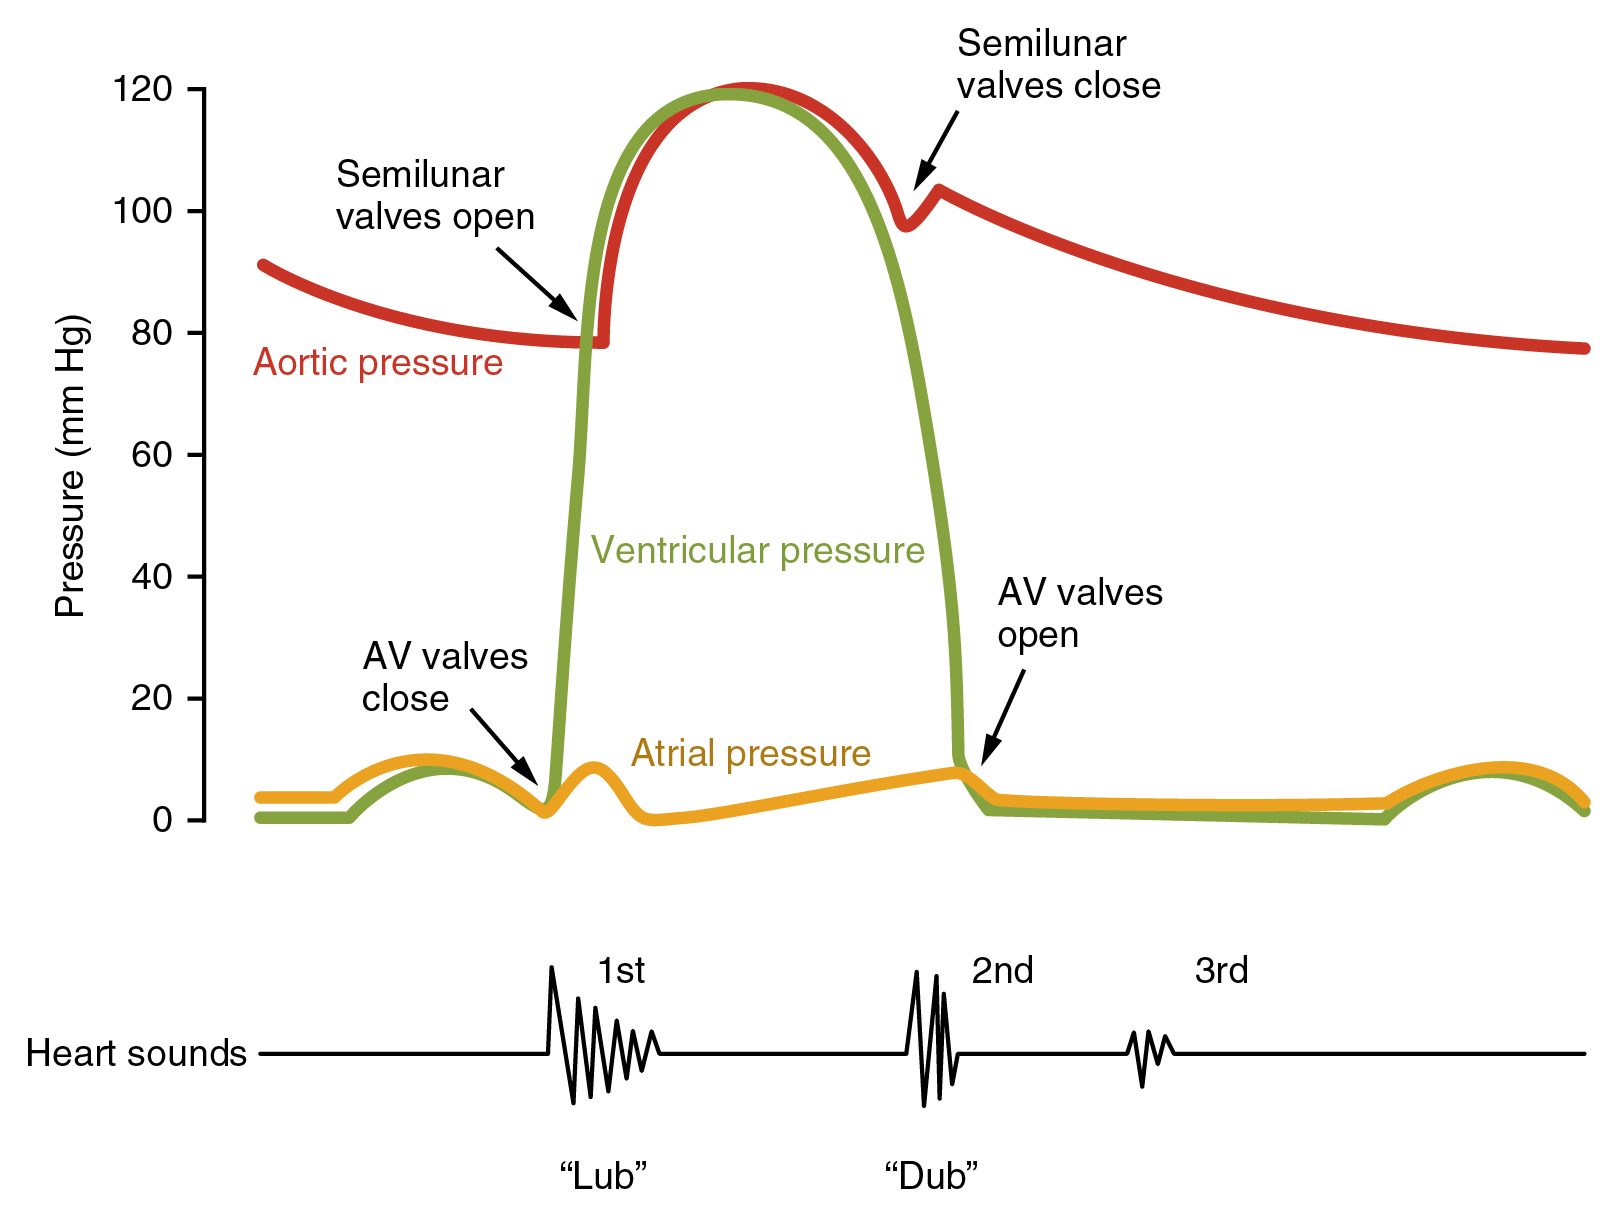 Now we are looking at the cardiac cycle in terms of pressure. Remember that the maximum pressure developed by a normal heart is 120 mm Hg; at relaxation (ventricular systole), the lowest pressure is 80 mm Hg. (We say the normal blood pressure, measured at the nearby left brachial artery, is “one twenty over eighty”.) This is shown by the red line.
The atria normally see very low pressure, never more than 10 mm Hg. This is shown by the gold line. We will see this again in a later diagram in this objective.
Ventricular pressure varies by a lot. It is represented by the green line. When ventricular pressure is greater than atrial pressure, the AV valves close. For a brief time, as pressure builds in the ventricles (isovolumetric contraction), the semilunar valves are also closed. (Recall that the semilunar valves, the pulmonary valve and the aortic valve, are also called outflow valves.) As the pressure in the ventricles exceeds 80 mm Hg, the pressure in the ventricles is greater than the remaining pressure of blood in the aorta and lungs and the outflow valves open. Blood rushes out of the ventricles and into the pulmonary and systemic circuits. This is shown where the red and green lines meet. Eventually, the pressure in the ventricles is less than the remaining aortic pressure and the outflow valves close. (Even though it’s not shown, the same thing happens to the pressure in the pulmonary trunk.) As the pressure in the ventricles drops below the pressure in the atria, the AV valves open.
The movement of valves can be heard through a stethoscope, a process called auscultation. The closing of the AV valves, and the opening of the semilunar valves, is heard as a “lub” sound. The closing of the semilunar valves, and the opening of the AV valves, is heard as a “dub” sound. “Lub” is called the first heart sound and “dub” is the second heart sound. Much information can be gained just from listening to the heart. For example, blood squeezing through a partially-closed mitral valve during the second heart sound makes a characteristic noise which can be used to diagnose mitral valve prolapse, the most common valve defect in the heart.
Measuring Heart Function
In measuring the output of the heart, there are two relevant parameters: heart rate and stroke volume.
Heart rate is how many cardiac cycles there are per minute. We usually measure this as a pulse. A normal pulse is considered to be 72 beats per minute (bpm).
Stroke volume is how much blood is ejected from the heart with each cardiac cycle. This is much harder to measure and cannot be determined with a stethoscope, blood pressure cuff (spygmomanometer), or fingers on a wrist. The stroke volume is measured by visualizing the heart with ultrasound and is calculated from the volume of the heart at the end of diastole (end-diastolic volume, EDV) minus the volume of the heart at the end of systole, when the heart is maximully contracted and at its smallest (end-systolic volume, ESV).
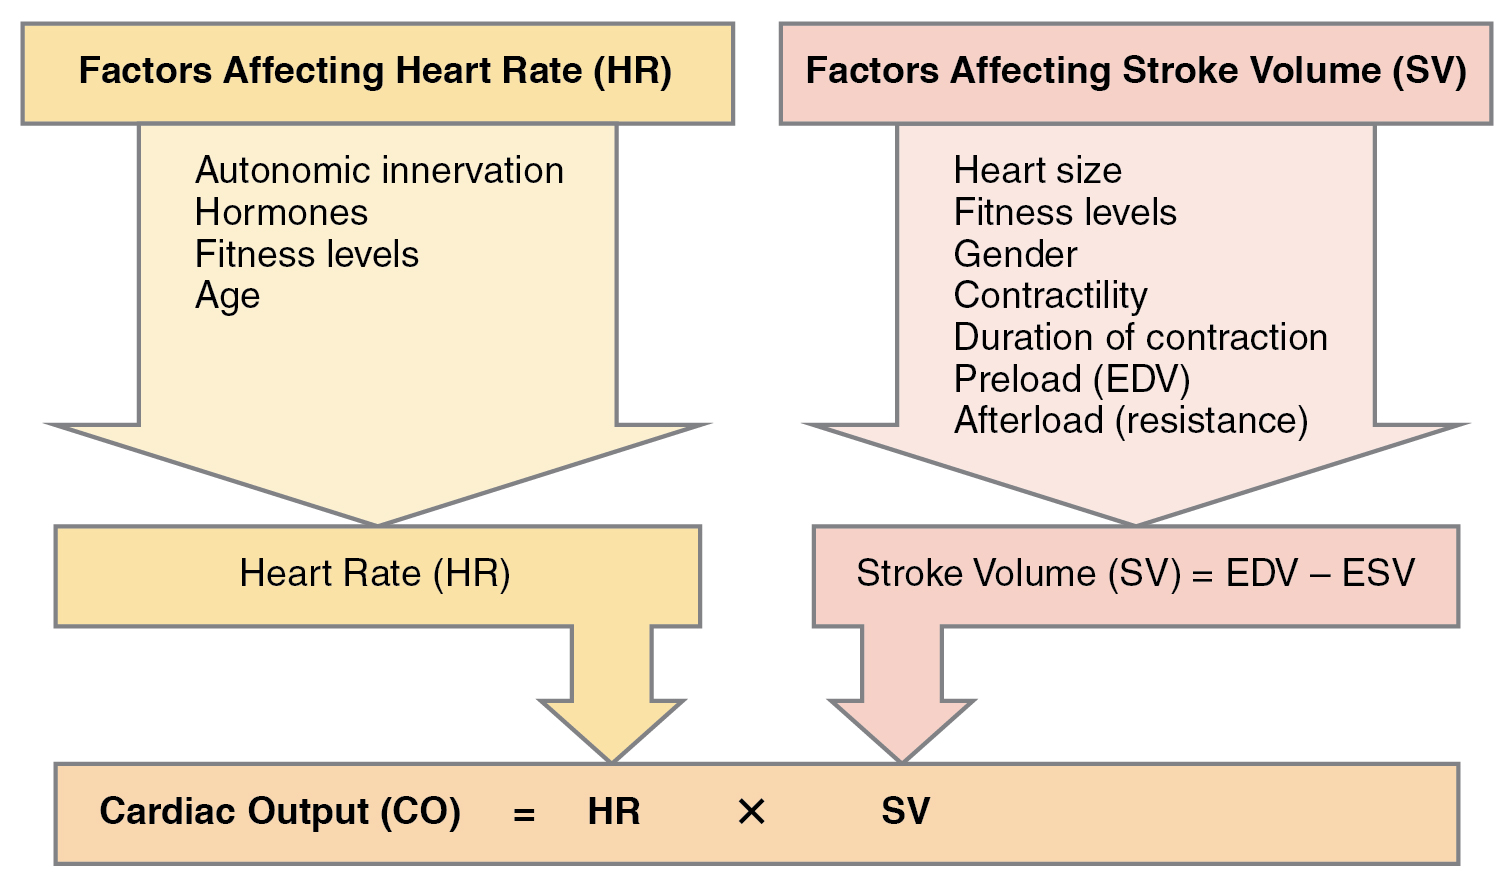 Cardiac output is the number of strokes per minute (heart rate) times the amount of blood expelled each cycle (stroke volume). Typically, this works out to 5-6 liters per minute at rest:
72 beats per minute × 70 milliliters per stroke
72 beats per minute × 0.07 liters per stroke = 5 liters per minute
In trained athletes, cardiac output can go as high as 35 liters per minute:
200 beats per minute × 0.175 liters per stroke = 35 liters per minute
Typically, in the clinic, we use ultrasound to measure the ejection fraction. This is
(ESV/EDV) × 100
so even though it is called a “fraction” it’s expressed as a percent, which is the fraction times 100.
Remember that the cardiac output is EDV – ESV. The mean value for a middle-aged man’s EDV is 156 mL and the mean value for his ESV is 65 mL. In this circumstance, the stroke volume would be
156 mL – 65 mL = 91 mL
and the ejection fraction would be
( stroke volume / end diastolic volume ) × 100
( 91 mL / 156 mL ) × 100 = 58%
For a middle-aged female, the mean EDV is 116 mL and the mean ESV is 43 mL.
This gives a stroke volume of
116 mL – 43 mL = 73 mL
and an ejection fraction of
( 73 mL / 116 mL ) × 100 = 62%
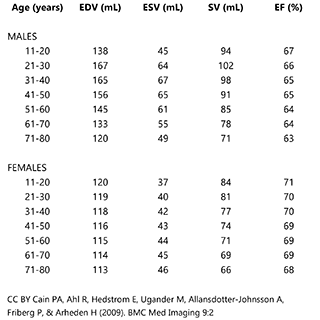
This table shows average values for the heart parameters we’ve discussed. These values were obtained from studies imaging the hearts of males and females at various ages. Note the ejection fraction (EF) is typically about 65% for males and about 70% for females.
Blood Pressure in the Systemic Circuit
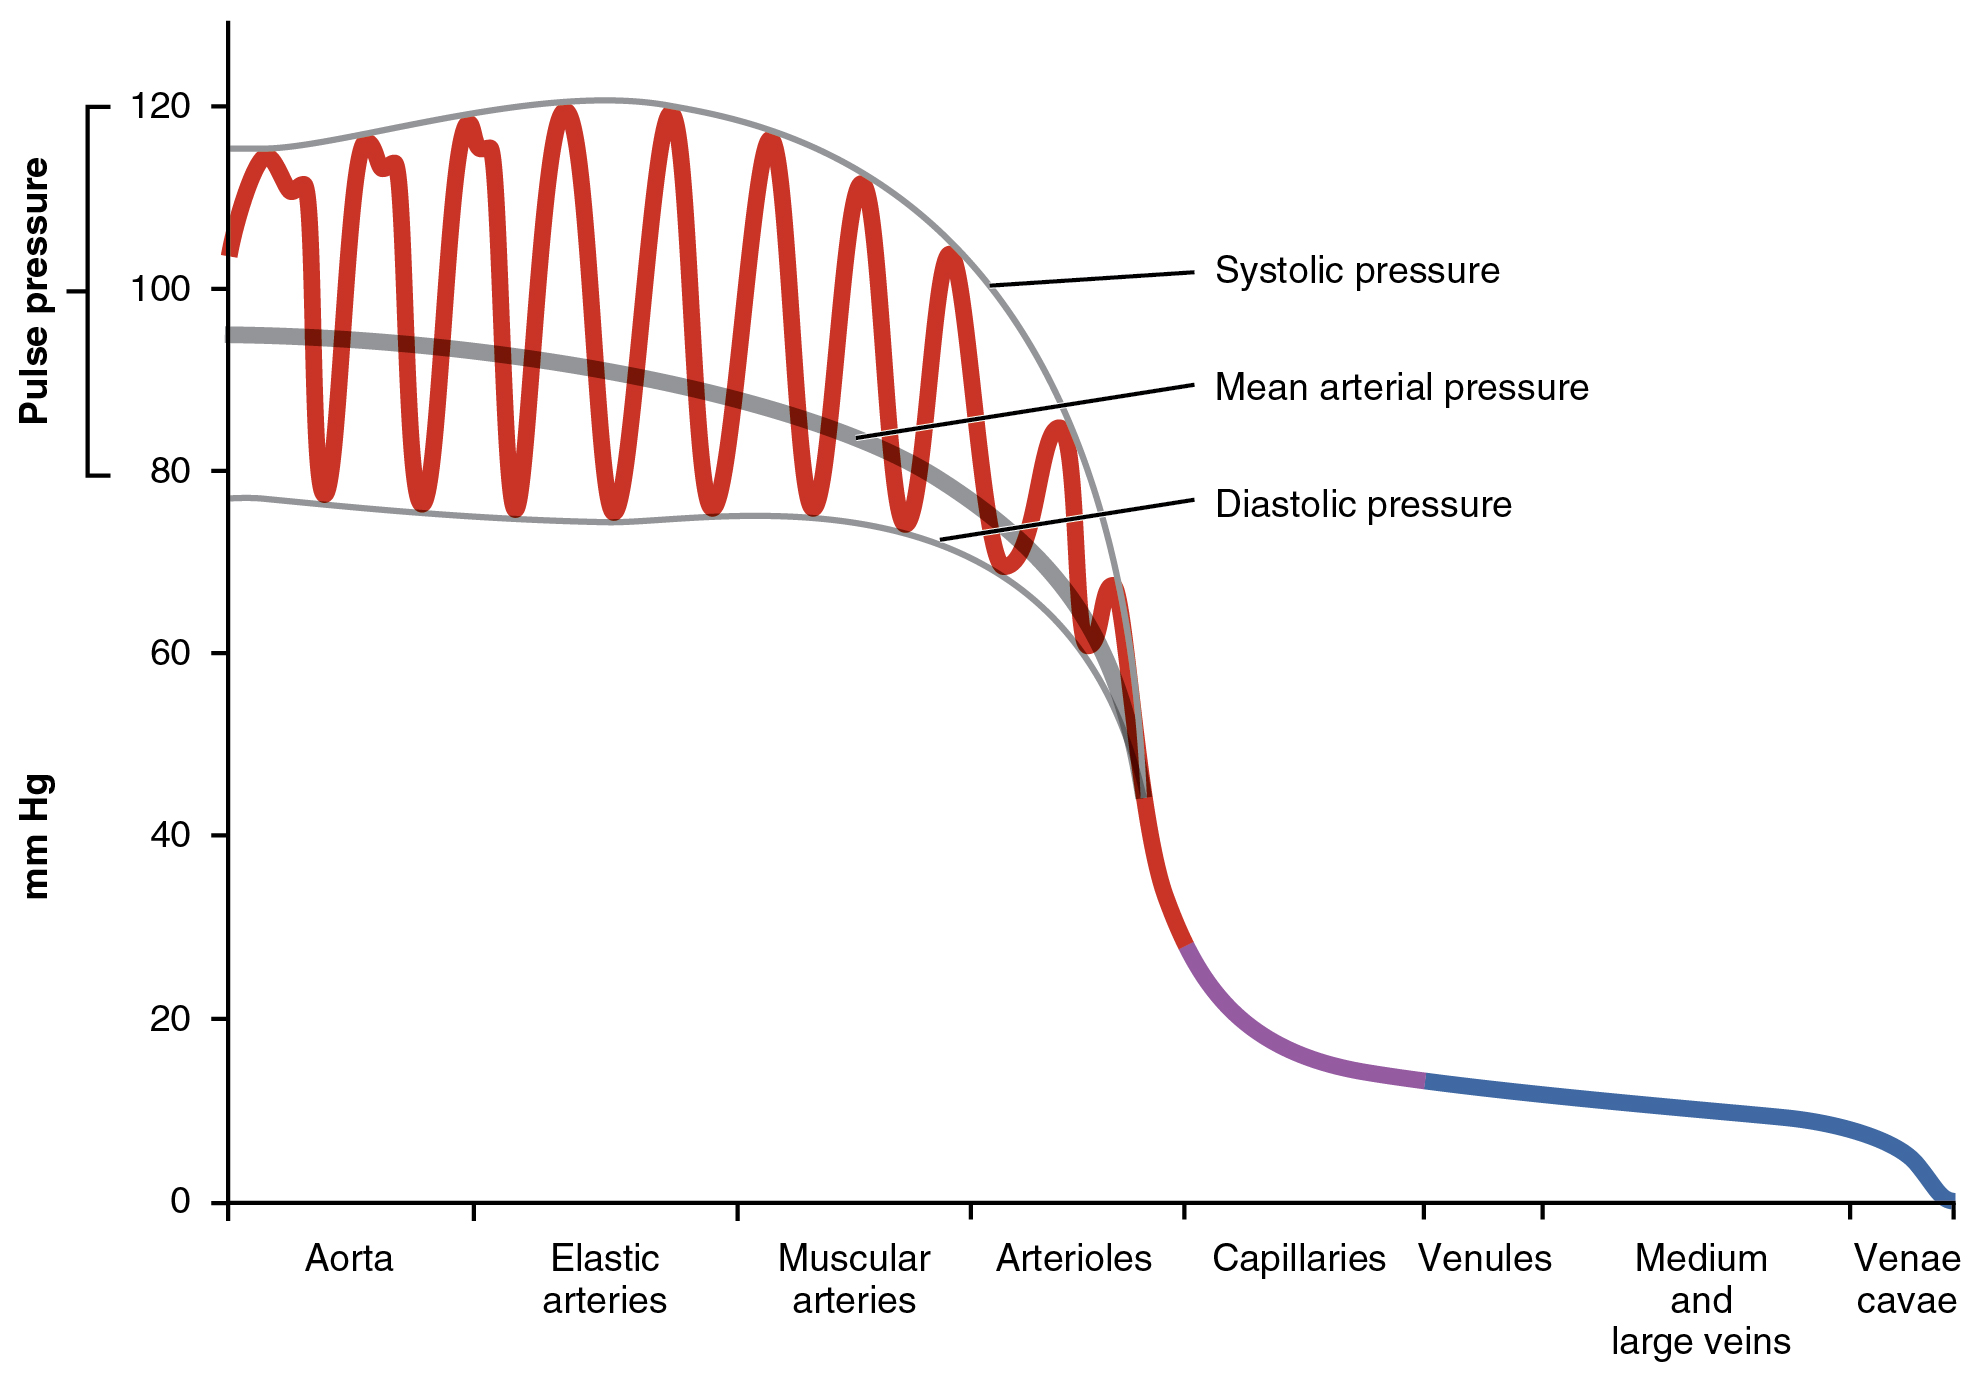 The blood pressure varies greatly at different points in the systemic circuit. Near the aorta, as expected, the pressure varies between 120 mm Hg when the heart is contracting (systolic pressure) and 80 mm Hg when the heart is relaxed (diastolic pressure). The difference between systolic and diastolic pressure is marked in the aorta, elastic arteries, and muscular arteries and is called the pulse pressure.
As the vascular tree branches, and blood enters arterioles, it encounters a pressure drop that brings the pressure down to about 35 mm Hg as it enters the capillary. As the blood traverses the capillary, from the arteriole end to the venule end, the pressure drops even more, down to about 18 mm Hg as it exits the capillary and enters the venule.
The pressure drop across the length of a capillary, from the arteriole end to the venule end, will be discussed next and will be important in understanding how capillaries work.
There is a slower drop in pressure throughout the venous part of the vascular tree. By the time blood moves from the inferior and superior venae cavae to the right atrium, its pressure is less than 10 mm Hg and is often close to zero.
Media Attributions
- U16-025 Overview of the Cardiac Cycle © Betts, J. Gordon; Young, Kelly A.; Wise, James A.; Johnson, Eddie; Poe, Brandon; Kruse, Dean H. Korol, Oksana; Johnson, Jody E.; Womble, Mark & DeSaix, Peter is licensed under a CC BY (Attribution) license
- U16-026 ECG Tracing Correlated to the Cardiac Cycle © Betts, J. Gordon; Young, Kelly A.; Wise, James A.; Johnson, Eddie; Poe, Brandon; Kruse, Dean H. Korol, Oksana; Johnson, Jody E.; Womble, Mark & DeSaix, Peter is licensed under a CC BY (Attribution) license
- U16-027 Relationship Between the Cardiac Cycle and ECG © Betts, J. Gordon; Young, Kelly A.; Wise, James A.; Johnson, Eddie; Poe, Brandon; Kruse, Dean H. Korol, Oksana; Johnson, Jody E.; Womble, Mark & DeSaix, Peter is licensed under a CC BY (Attribution) license
- U16-028 Heart Sounds and the Cardiac Cycle © Betts, J. Gordon; Young, Kelly A.; Wise, James A.; Johnson, Eddie; Poe, Brandon; Kruse, Dean H. Korol, Oksana; Johnson, Jody E.; Womble, Mark & DeSaix, Peter is licensed under a CC BY-SA (Attribution ShareAlike) license
- U16-029 Major Factors Influencing Cardiac Output © Betts, J. Gordon; Young, Kelly A.; Wise, James A.; Johnson, Eddie; Poe, Brandon; Kruse, Dean H. Korol, Oksana; Johnson, Jody E.; Womble, Mark & DeSaix, Peter is licensed under a CC BY (Attribution) license
- U16-029a Age and Gender Specific Normal Values © Cain, Peter A,; Ahl, Ragnhild; Hedstrom, Erik; Ugander, Martin; Allansdotter-Johnsson, Ase; Friberg, Peter and Arheden, Hakan is licensed under a CC BY (Attribution) license
- U16-030 Systemic Blood Pressure © Betts, J. Gordon; Young, Kelly A.; Wise, James A.; Johnson, Eddie; Poe, Brandon; Kruse, Dean H. Korol, Oksana; Johnson, Jody E.; Womble, Mark & DeSaix, Peter is licensed under a CC BY (Attribution) license
