Transport of Gases
Objective 8
Be able to label and explain important features of the oxygen-hemoglobin saturation curve. Describe how different conditions (oxygen partial pressure, temperature, carbon dioxide partial pressure) might alter the saturation curve. Compare and contrast the oxygen saturation curve for fetal and adult hemoglobin. State the ways carbon dioxide is carried in the blood, and rank their relative importance. State the chemical equation which describes the relationship between carbon dioxide, bicarbonate ion, and carbonic acid in blood. Predict how raising and lowering pH or carbon dioxide concentration will affect this system.
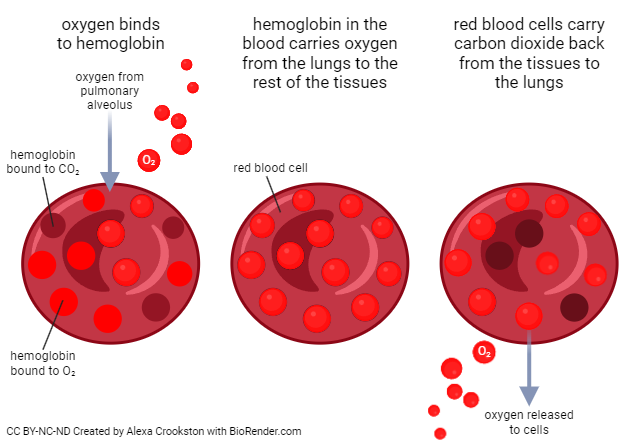
Now let’s turn our focus to how we transport oxygen and carbon dioxide in the blood. Oxygen and carbon dioxide are carried through the bloodstream in different forms. For oxygen, 98.5% is bound to hemoglobin in RBCs and 1.5% is dissolved in the plasma. With carbon dioxide, 70% travels through the bloodstream as bicarbonate (HCO3 –), 23% is bound to hemoglobin in RBCs, and 7% is dissolved in the plasma.
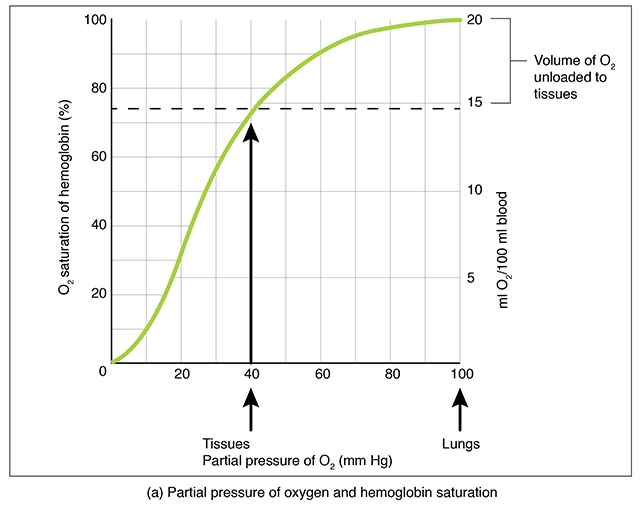
As was mentioned, 98.5% of oxygen is carried bound to hemoglobin in RBCs and 1.5% is dissolved in the plasma. The O2-hemoglobin saturation curve shows the proportion of Hb bound to O2 . The higher the PO2 (X axis, left-right) the more oxygen is bound to Hb (Y axis, up-down).
Certain conditions influence the O2 -Hb saturation curve. During conditions such as exercise, tissues need more oxygen.
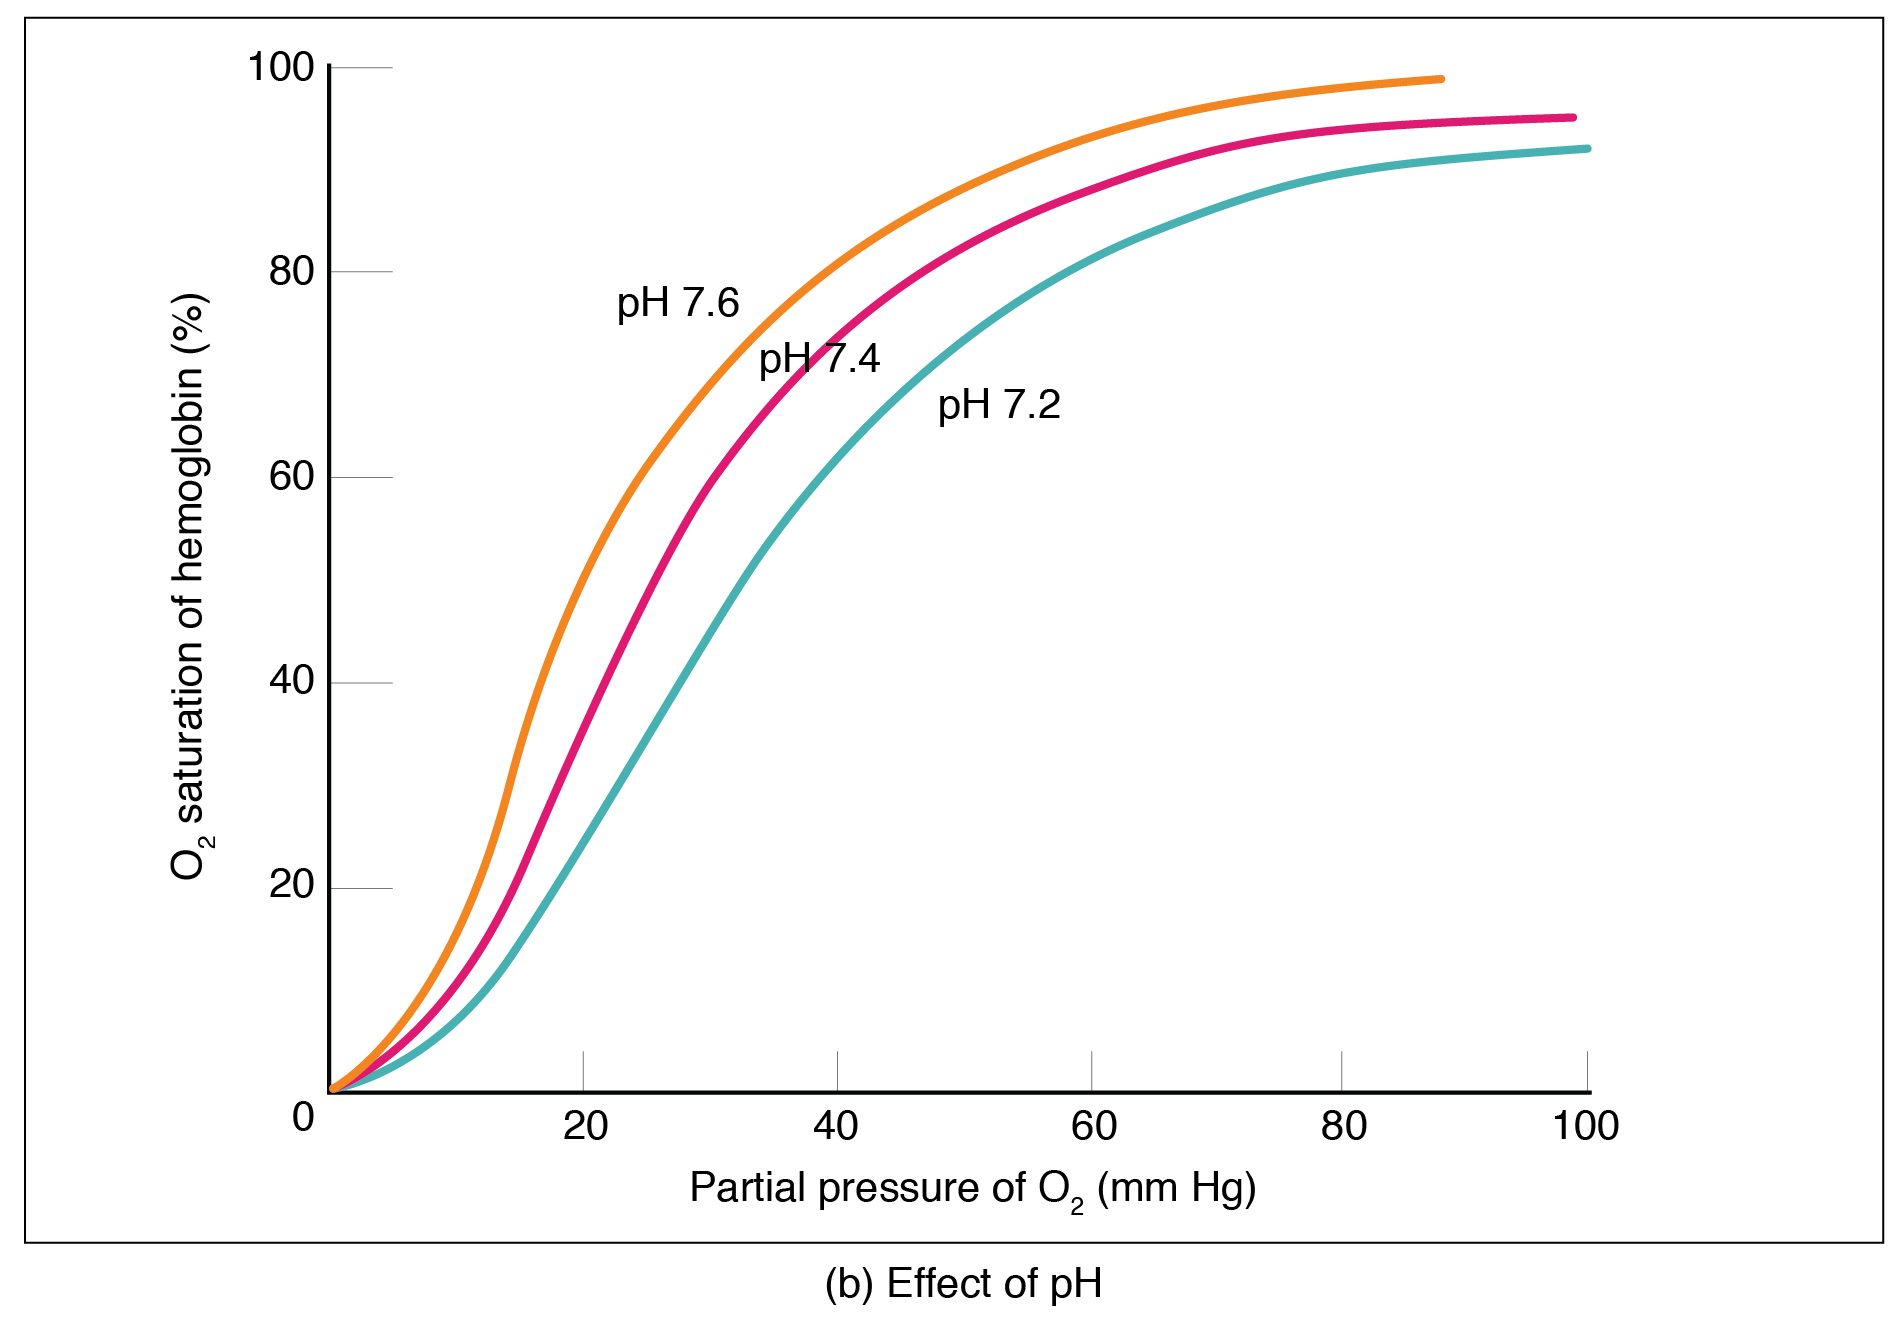
Actively working tissues generate acids as waste, lowering the pH. A drop in pH shifts the curve to the right, causing more O2 to be released at the tissues (see the teal line).
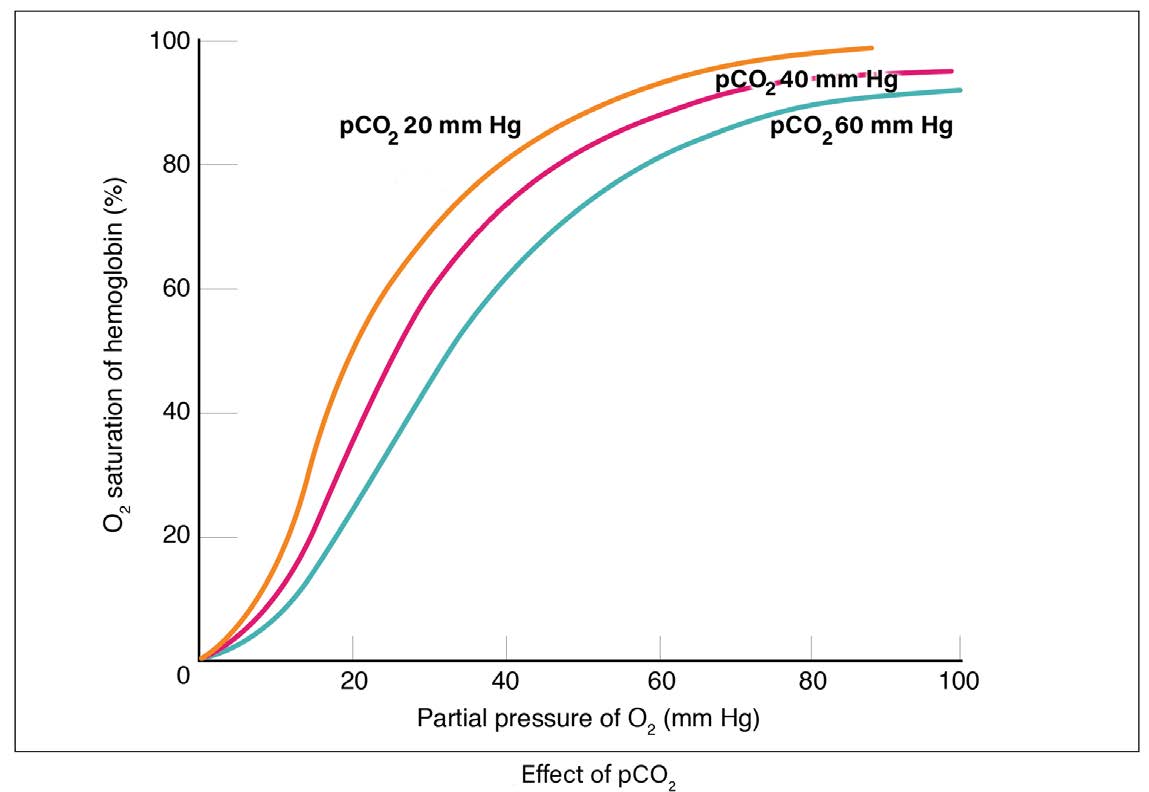
Actively working tissues also generate more CO2 as waste. Higher PCO2 levels shift the curve to the right and more O2 is delivered to the tissues. A tissue that is resting generates less CO2 . This shifts the curve to the left and less O2 is delivered to the tissues.
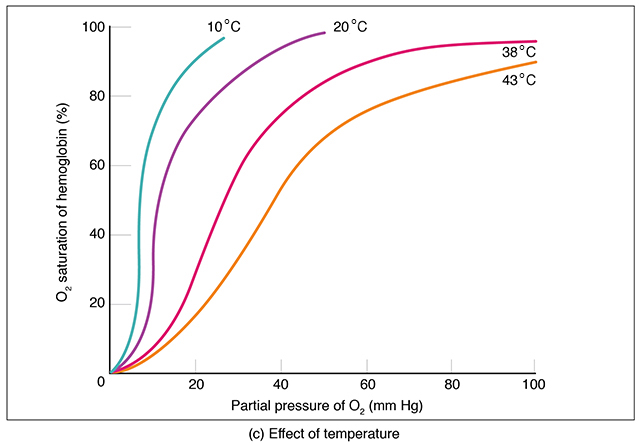
Actively working tissues also generate heat. Higher temperatures shift the curve to the right, and more O2 is delivered. Resting tissue generates less heat, and less O2 is delivered.
When we’re sick and have a fever, more O2 is delivered to the tissues helping them fight infection. Ingenious!
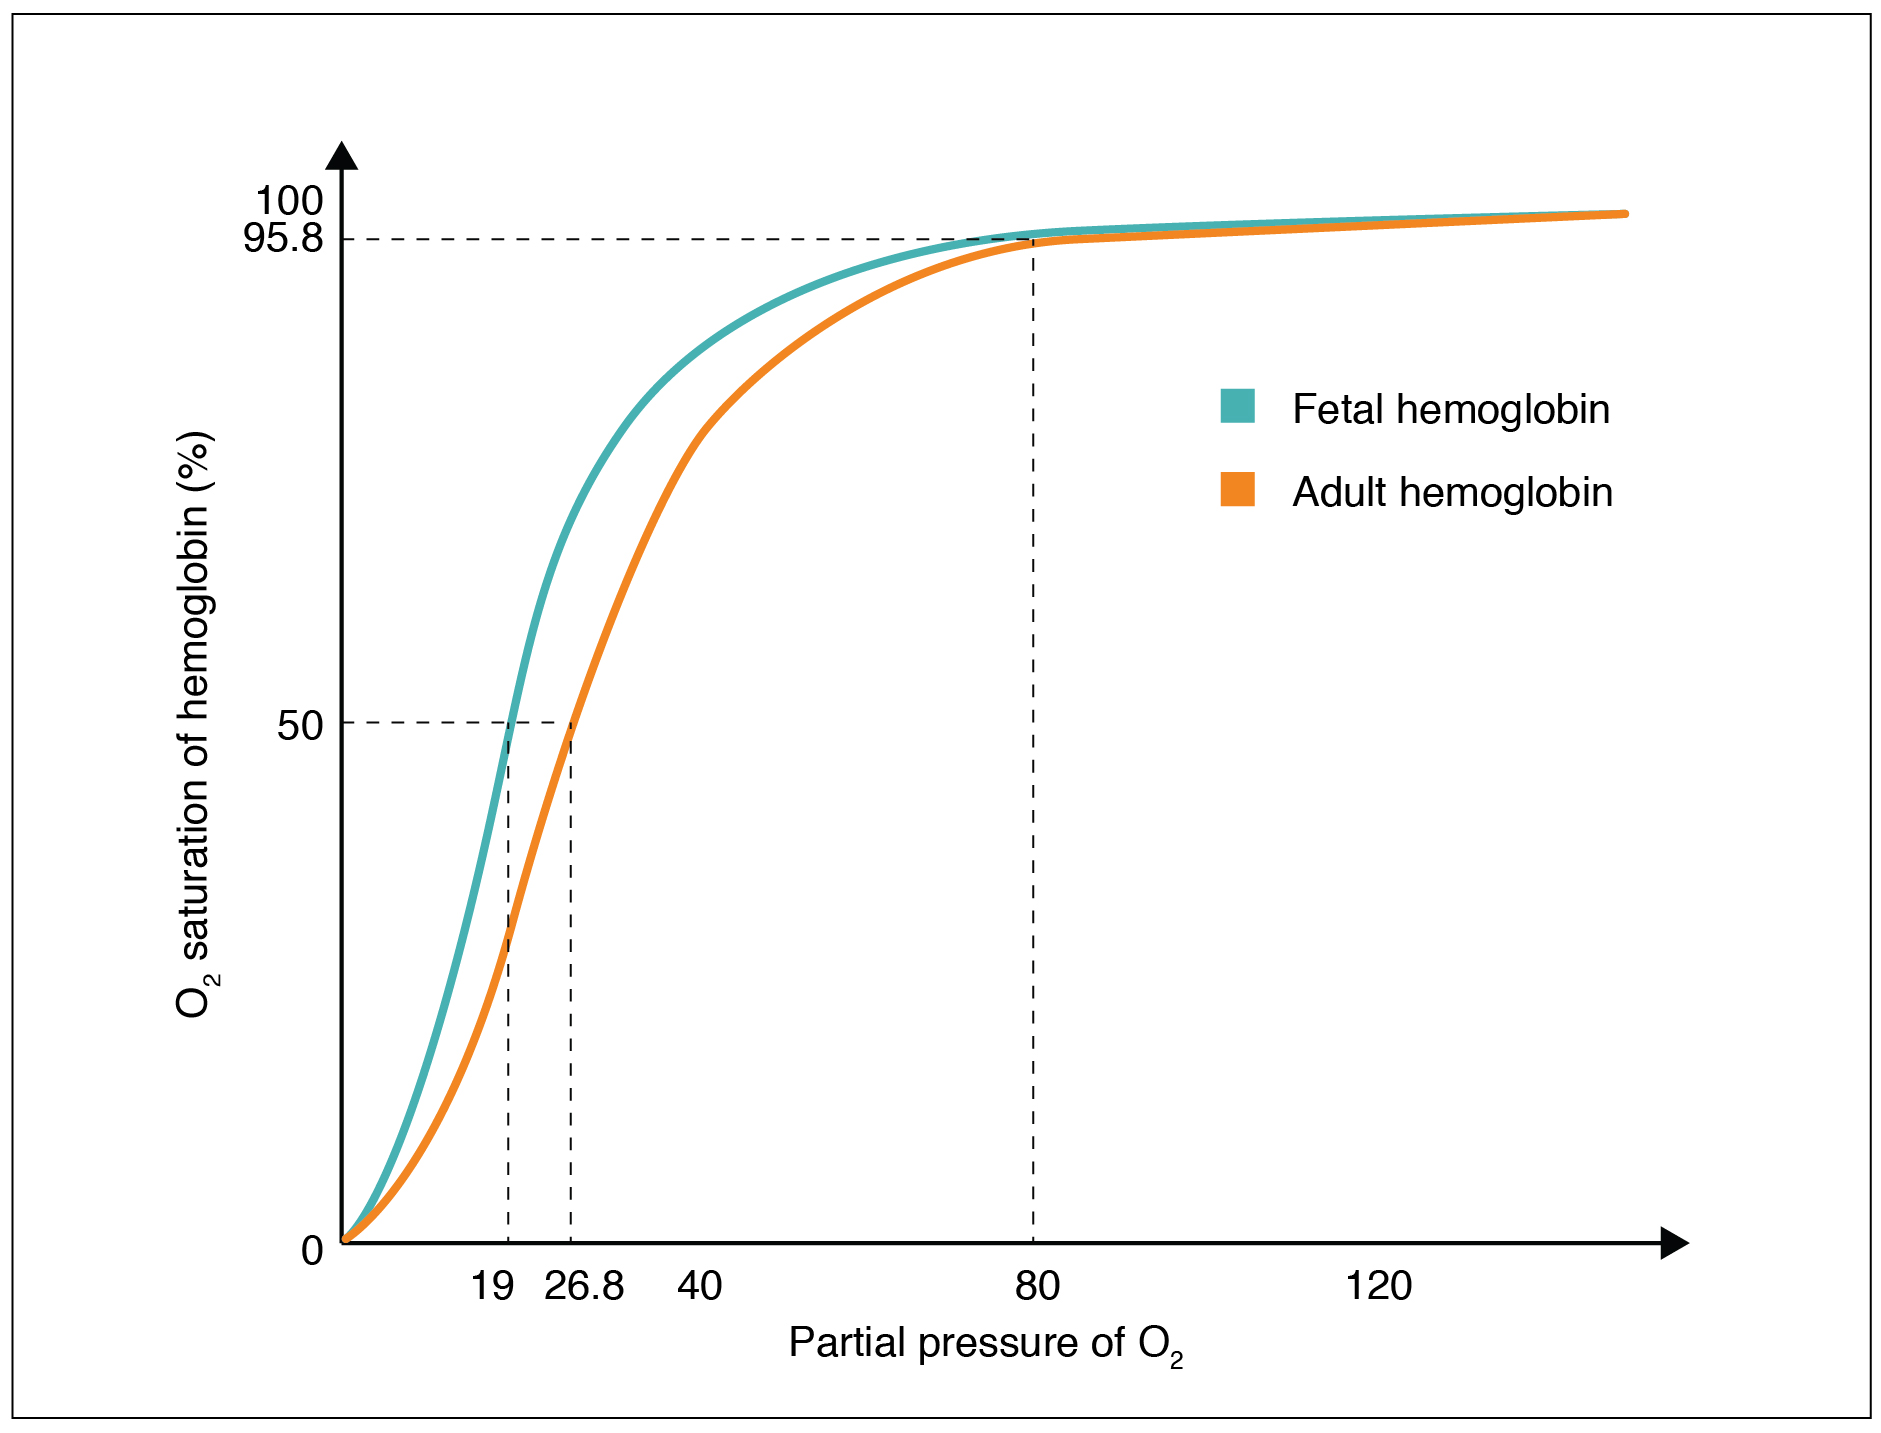
Fetal Hb has a higher affinity for O2 than adult Hb. When PO2 is low, fetal Hb can carry up to 30% more O2 than maternal Hb. Because of this, oxygen diffuses easily from maternal RBCs to fetal RBCs across the placenta.
Carbon Dioxide
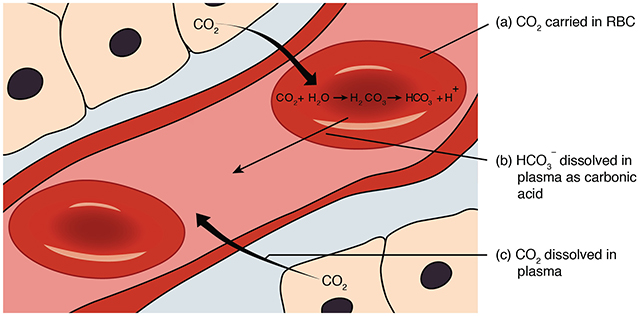
As discussed earlier, 70% of CO2 travels through the bloodstream as bicarbonate (HCO3 –), 23% is bound to hemoglobin in RBCs, and 7% is dissolved in the plasma.
The conversion of CO2 to bicarbonate to be carried in the plasma is a somewhat complicated process.
First, CO2 combines with H2O in the red blood cell to form carbonic acid (HCO3 –). Acids donate H+ ions, so carbonic acid dissociates to HCO3 – and H+ . The bicarbonate ions leave the RBC in exchange for Cl– ions. At the alveoli, the reaction reverses and CO2 is exhaled.
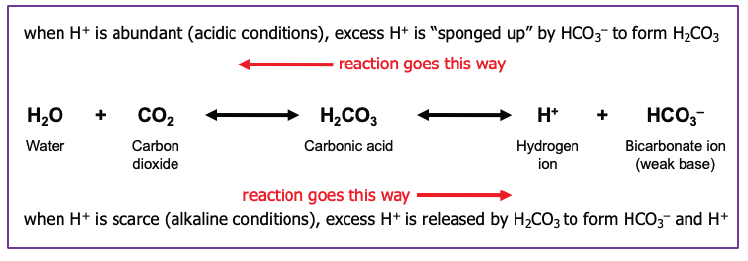
Buffers prevent rapid, drastic changes in pH of body fluids by converting strong acids and bases into weak acids and bases. This is a rapid conversion which takes place in fractions of a second. Most buffer systems in the body consist of a weak acid and a weak base.
Buffer reactions, like that in the equation above, can proceed from left to right or right to left. In the carbonic acid-bicarbonate buffer system, excess hydrogen ions can be instantly converted to water and carbon dioxide. Under alkaline conditions, water and carbon dioxide are converted to hydrogen and bicarbonate ions. We will revisit this concept of buffers and pH control in a later objective.
Media Attributions
- U17-050 Oxygen in Hemoglobin v2 © Crookston, Alexa is licensed under a CC BY-NC-ND (Attribution NonCommercial NoDerivatives) license
- U17-051 Hb Saturation Curve © Betts, J. Gordon; Young, Kelly A.; Wise, James A.; Johnson, Eddie; Poe, Brandon; Kruse, Dean H. Korol, Oksana; Johnson, Jody E.; Womble, Mark & DeSaix, Peter adapted by Jim Hutchins is licensed under a CC BY (Attribution) license
- U17-052 Hb Saturation Curve pH © Betts, J. Gordon; Young, Kelly A.; Wise, James A.; Johnson, Eddie; Poe, Brandon; Kruse, Dean H. Korol, Oksana; Johnson, Jody E.; Womble, Mark & DeSaix, Peter adapted by Jim Hutchins is licensed under a CC BY (Attribution) license
- U17-054b Hb Saturation Curve CO2 © Betts, J. Gordon; Young, Kelly A.; Wise, James A.; Johnson, Eddie; Poe, Brandon; Kruse, Dean H. Korol, Oksana; Johnson, Jody E.; Womble, Mark & DeSaix, Peter adapted by Justin Burr is licensed under a CC BY (Attribution) license
- U17-054a Hb Saturation Curve Temperature © Betts, J. Gordon; Young, Kelly A.; Wise, James A.; Johnson, Eddie; Poe, Brandon; Kruse, Dean H. Korol, Oksana; Johnson, Jody E.; Womble, Mark & DeSaix, Peter adapted by Jim Hutchins is licensed under a CC BY (Attribution) license
- U17-055 Hb Saturation Curve Fetus © Betts, J. Gordon; Young, Kelly A.; Wise, James A.; Johnson, Eddie; Poe, Brandon; Kruse, Dean H. Korol, Oksana; Johnson, Jody E.; Womble, Mark & DeSaix, Peter is licensed under a CC BY (Attribution) license
- U17-056 Transport of Gases in Blood © Betts, J. Gordon; Young, Kelly A.; Wise, James A.; Johnson, Eddie; Poe, Brandon; Kruse, Dean H. Korol, Oksana; Johnson, Jody E.; Womble, Mark & DeSaix, Peter is licensed under a CC BY (Attribution) license
- U17-057 Bicarbonate Carbonic Acid © Hutchins, Jim is licensed under a CC BY-SA (Attribution ShareAlike) license
