Electrical Activity of the Heart
Objective 3
State the anatomical and physiological principles underlying the electrical activity of the heart. Explain the electrical activity at all levels, from the electrocardiogram to the molecular and cellular structures which explain the heart’s electrical activity.
Many of you may have seen that an animal’s heart keeps beating even after the animal is dead. This video shows that cardiac muscle cells, even when grown in a Petri dish, exhibit a spontaneous, rhythmic contraction. How can this be possible?
Pacemaker Cells of the Heart
The rhythmic electrical activity of the heart is in part due to the inherent electrical properties of each individual cell. The same principles we learned about electrical activity of excitable cells in Unit 13 still apply here. (You might want to take time to review these principles before diving into the rhythmic activity of the heart in this objective.) The same three ions will be discussed: sodium (Na+), potassium (K+), and calcium (Ca2+). Because of the special way these are managed in the excitable cells of the heart, the healthy heart responds to different stimuli, and the unhealthy heart can be treated with drugs that do not affect other excitable cells. (Drugs which affect the rhythm and excitability of the heart are beyond the scope of this course but will be a big part — you might even say “the heart” — of a pharmacology course you might take later.)
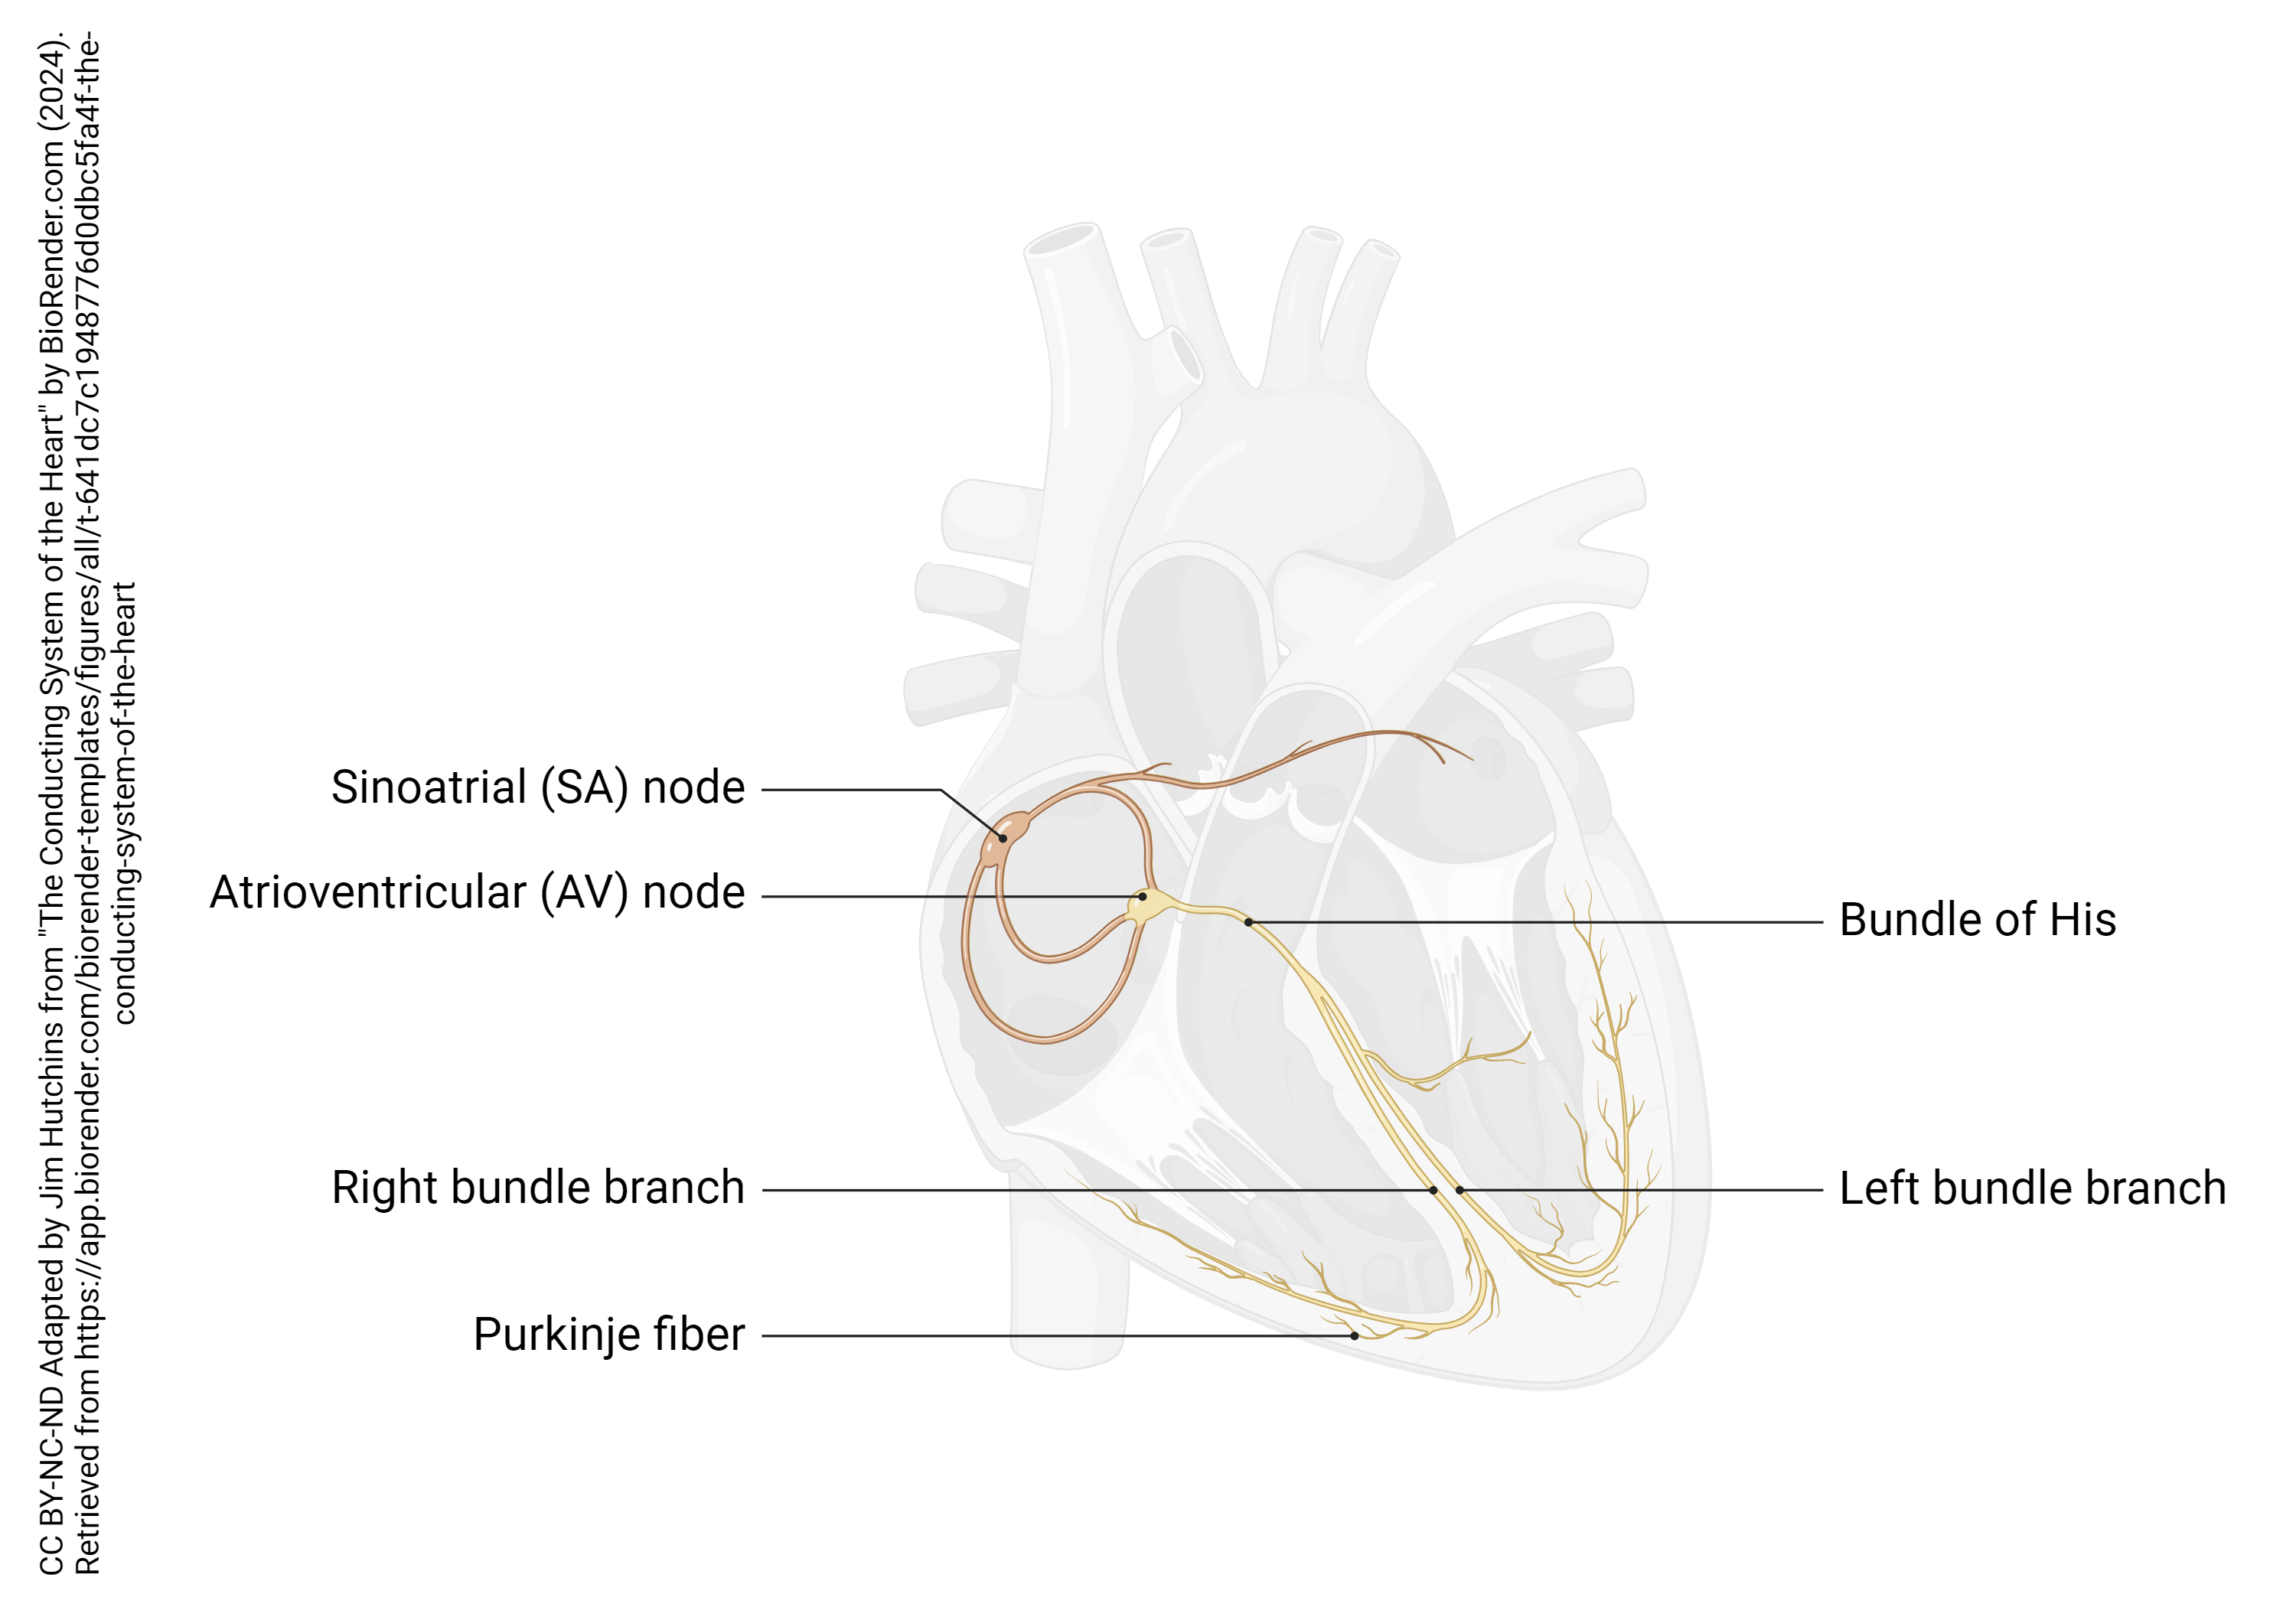
The spontaneous electrical activity of the heart is triggered by two groups of pacemaker cells: the main pacemaker in the sinoatrial (SA) node, and a backup pacemaker in the atrioventricular (AV) node. The SA node, as the name implies, is located near both the cardiac sinus and the right atrium, near the entry of the superior vena cava; the AV node is located near the junction between the right atrium and the right ventricle.
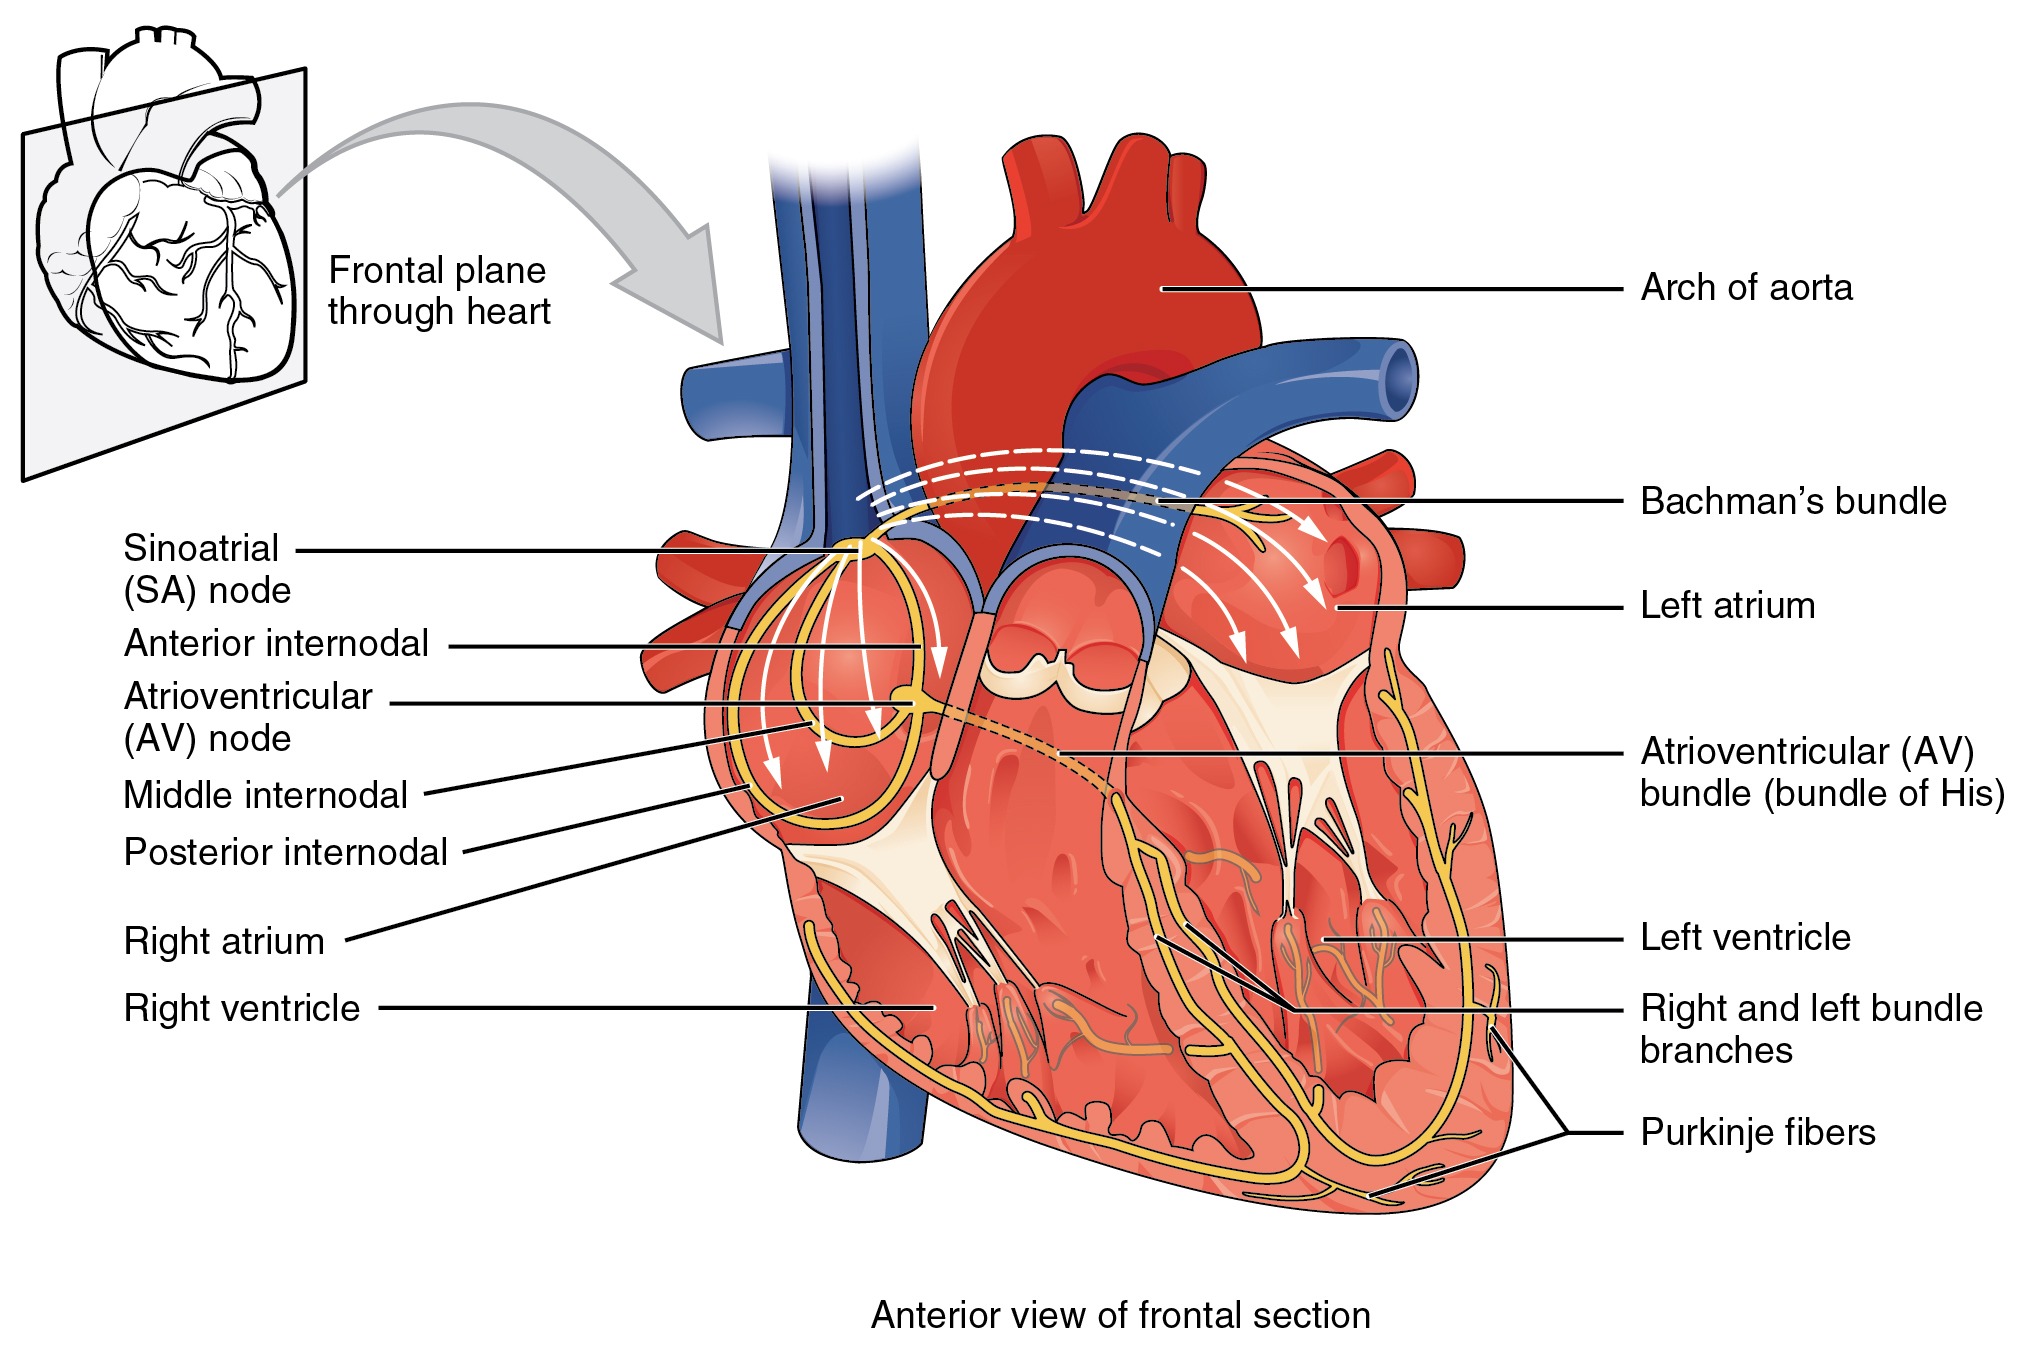
Several specialized cells, neither nerve nor muscle but a little bit of both, help spread electrical activity over the heart so that the atria can contract simultaneously, and the ventricles can contract simultaneously. Normally, electrical activity spreads from the SA node to the right and left atria, causing them to contract and push blood through the tricuspid and mitral (bicuspid) valves simultaneously. Then, the AV node pacemaker, activated by this electrical spread, sends a wave of voltage through the atrioventricular bundle (AV bundle; bundle of His). The AV bundle divides into right and left bundle branches, and these divide further, spreading the electrical signal into Purkinje fibers which are interwoven with the cardiac muscle cells of the ventricle in the myocardium. In all, it takes about 75 milliseconds (1/13 of a second) for the voltage wave to travel over the surface of the heart.
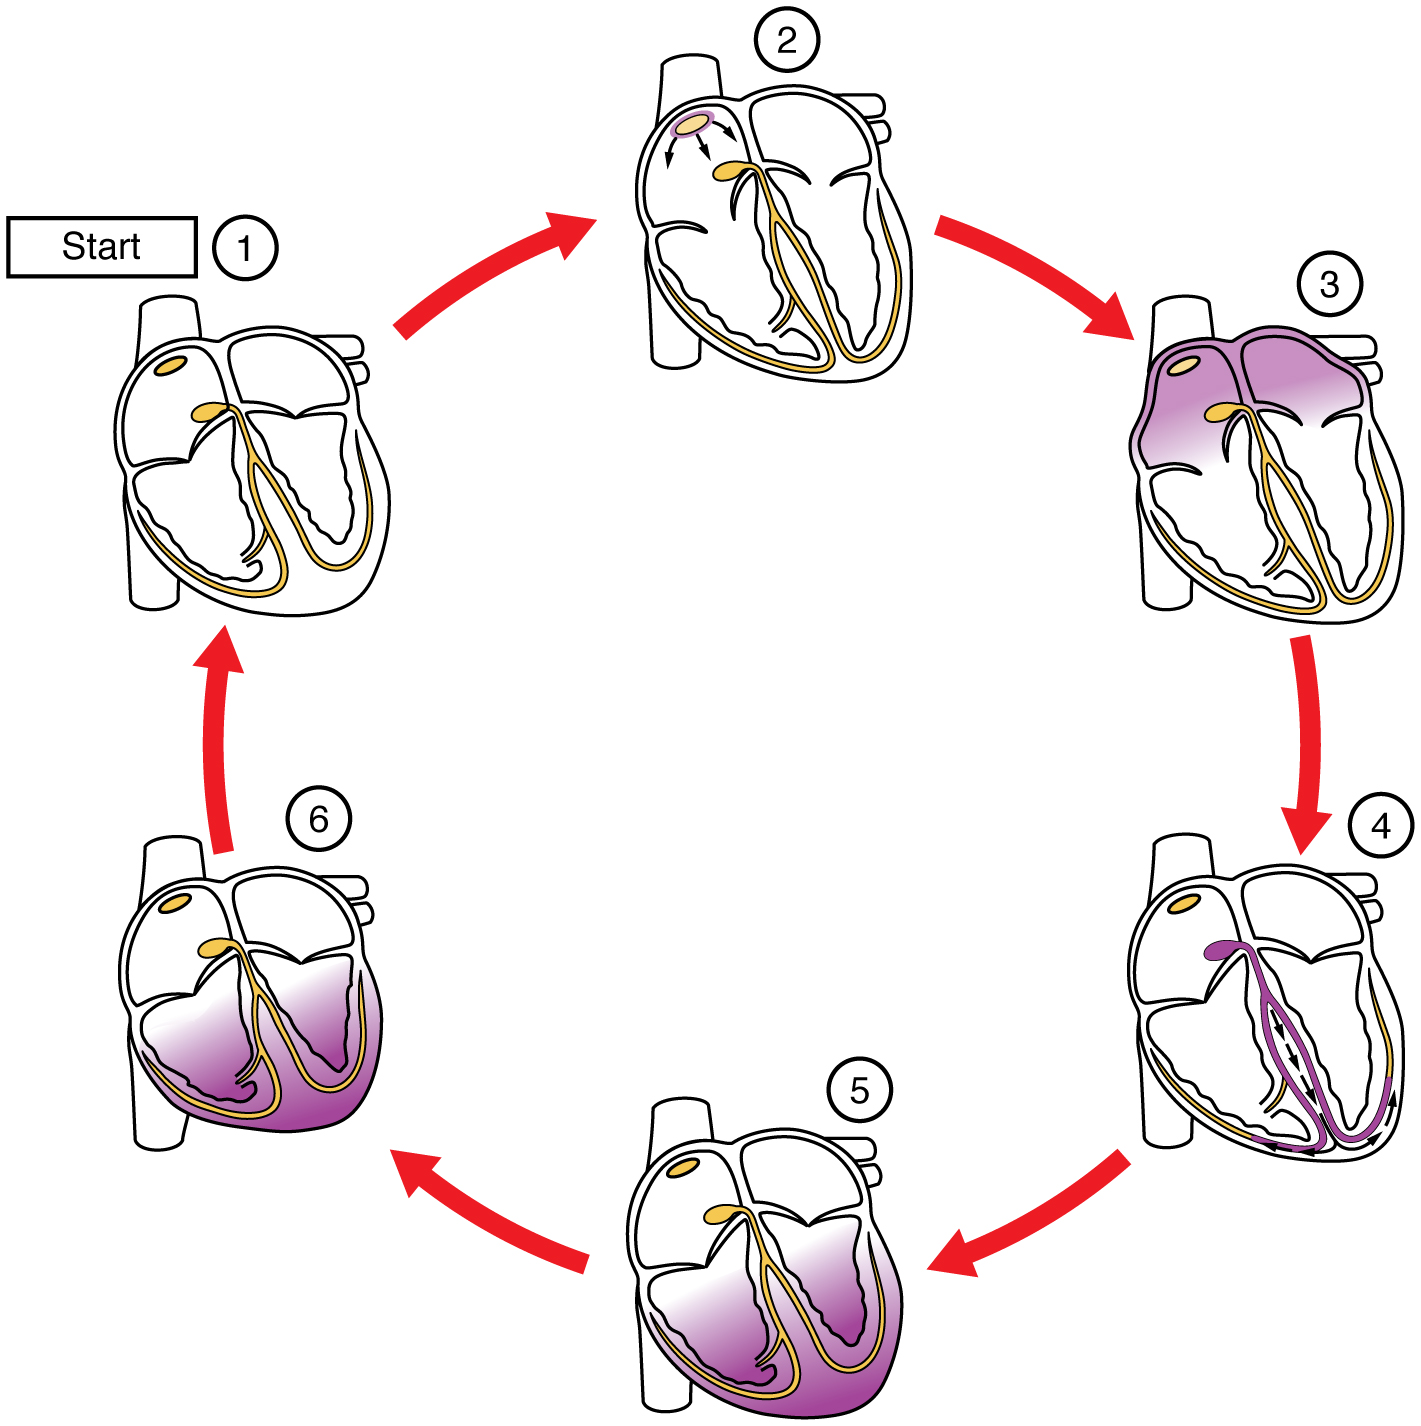 In this image, the purple shading indicates a wave of electrical depolarization. The SA node initiates the electrical wave (1) which passes over the surface of the right and left atria (2). Positive ions (Na+ and Ca2+) rush into the cardiac muscle cells, causing them to contract (3). Note that the atria contract first, followed by a short pause as the electrical wave is carried by the bundle branches and Purkinje fibers (4). The ventricles contract (5) then repolarize as K+ ions rush out of the muscle cells (6→1).
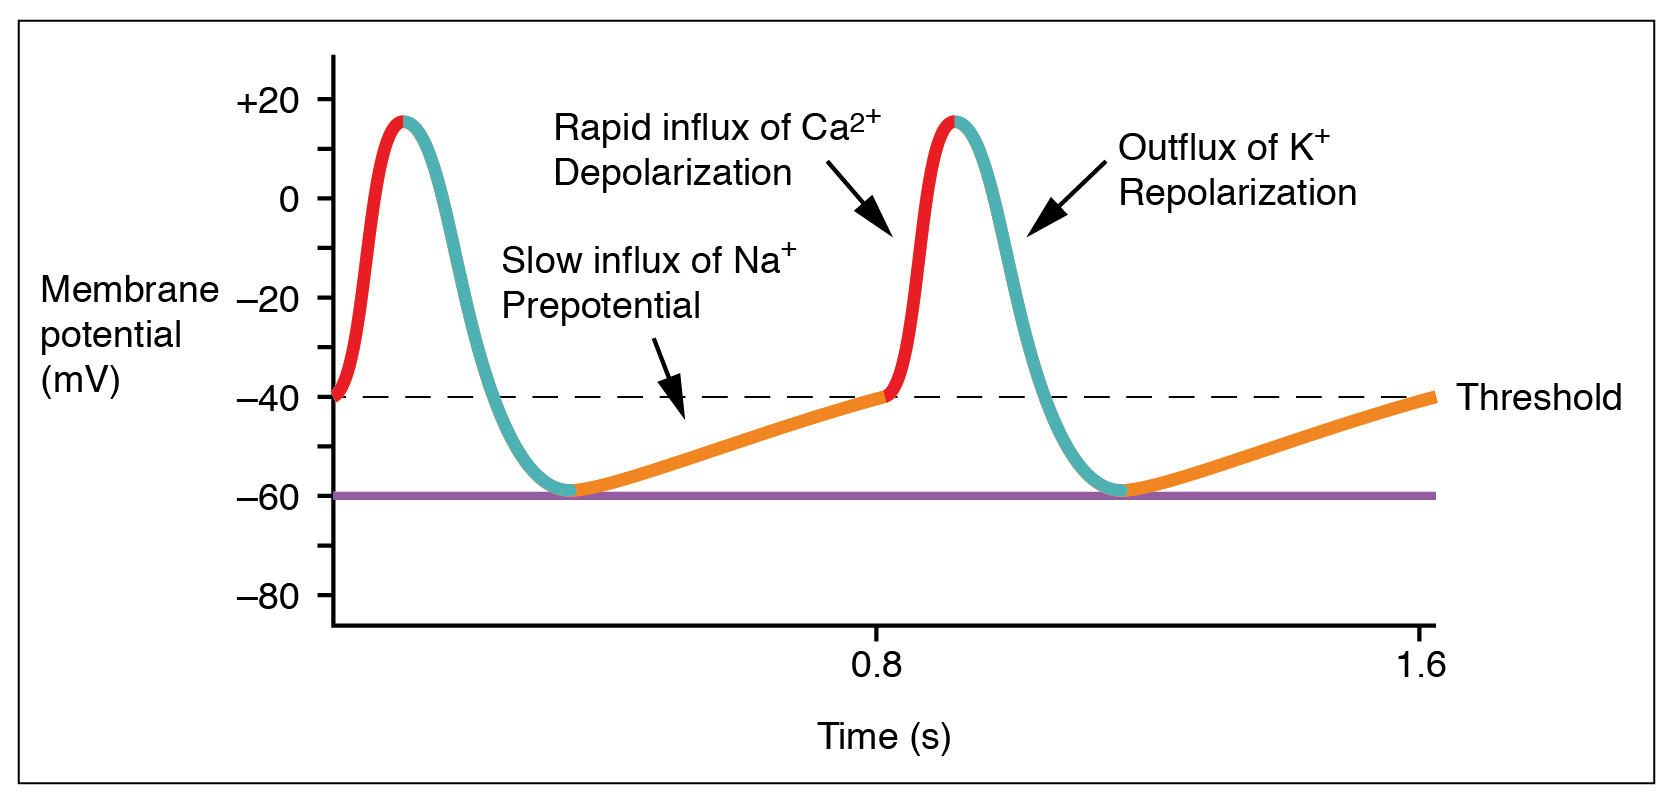 The electrical activity of a single SA node pacemaker cell is shown here. At first glance, this voltage (potential) graph resembles a muscle or nerve cell action potential, but there are several important differences.
It’s Funny How the Pacemaker Cells are Never at Rest
The membrane is never at rest! Rather, due to the action of a special sodium channel called (honest) the funny Na+ channel, there is an upward (depolarizing) drift in the membrane potential from a low value of –60 mV. Then, voltage-gated Ca2+ channels reach a threshold value around –40 mV, and trigger a Ca2+ spike — a rapid influx of Ca2+ ions, causing a rapid increase in intracellular voltage. As in the nerve action potential, the slower-to-activate voltage-gated K+ channels then open as the Ca2+ channels are closing, and K+ flows out of the cell. This repolarizes the SA node cell, dropping its membrane voltage back to –60 mV.
It takes about 0.83 sec for this process to complete a cycle. This results in a heart rate of 72 beats per minute:
1 min = 72 beats
60 sec = 72 beats
Divide both sides by 72 beats:
60 sec / 72 beats = 0.83 sec/beat
Autonomic Regulation of Heart Rate
 As we’ve seen previously, the autonomic nervous system can alter the heart rate. Now we can see how this happens at the molecular and cellular level.
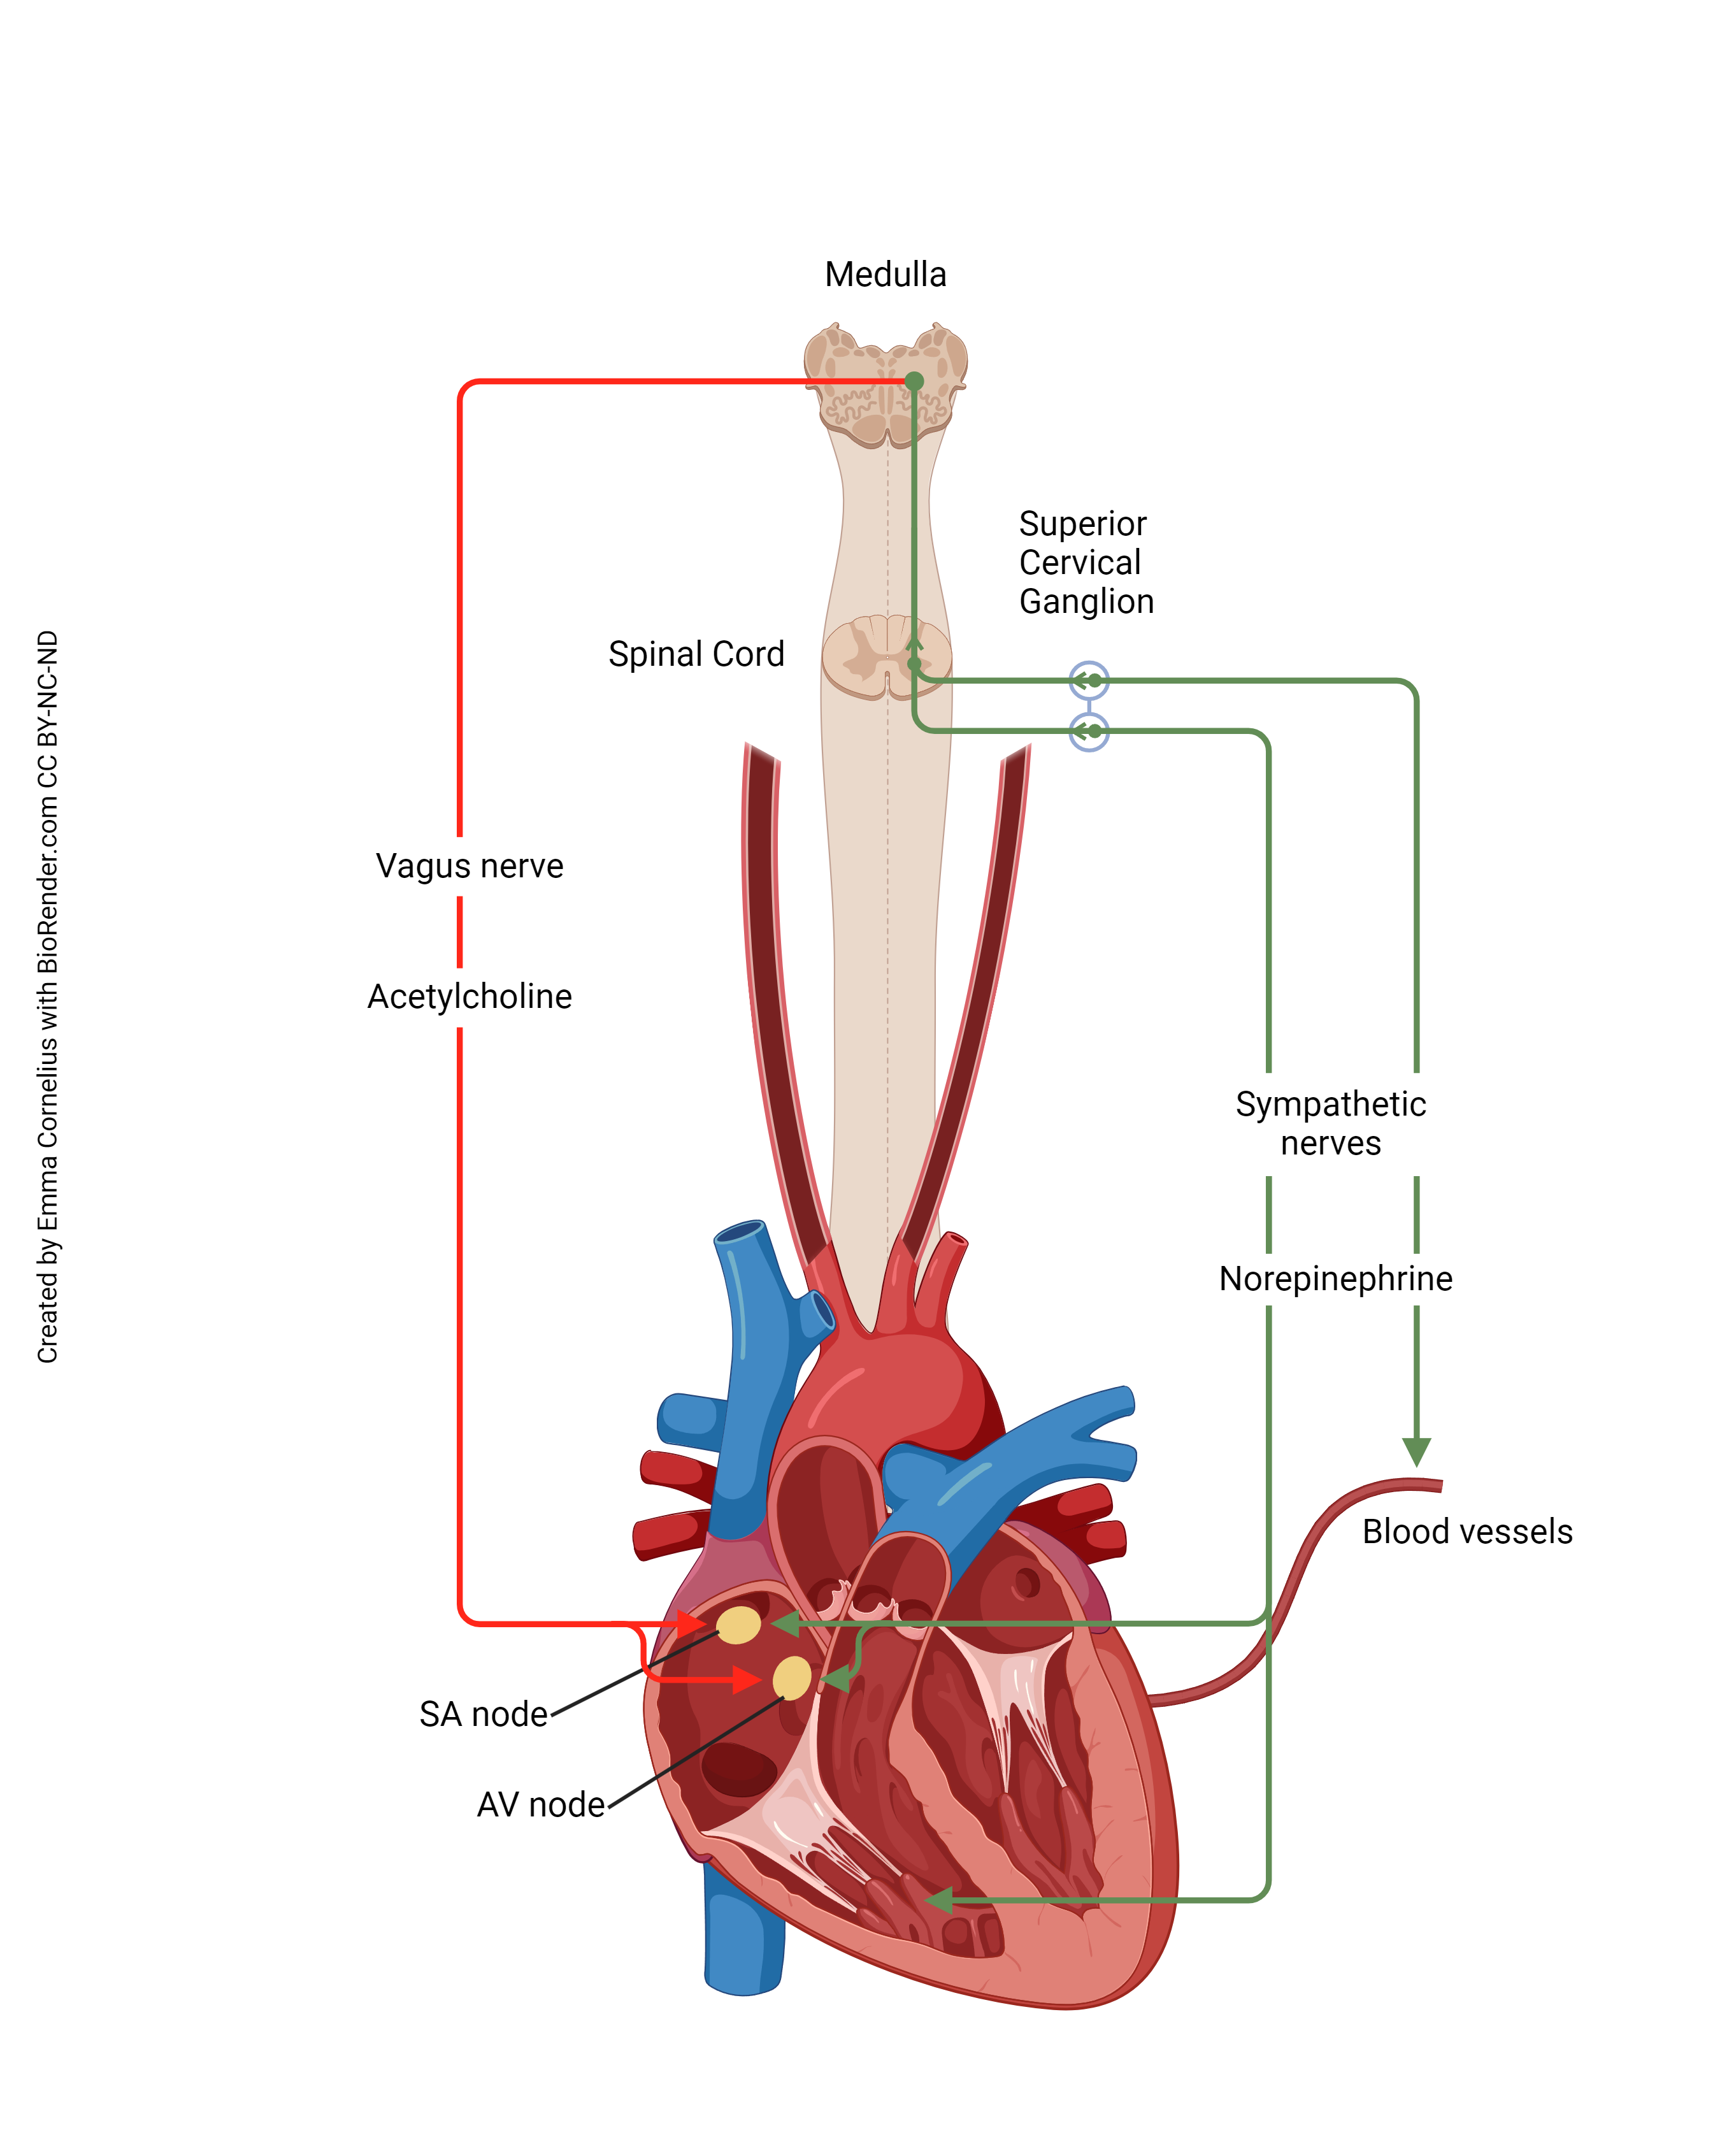
Activation of the sympathetic nervous system (green line) causes an increase in heart rate. The cell bodies of short preganglionic neurons are found in the lateral horn (intermediolateral cell column) of the thoracic spinal cord. These are activated by a visual, auditory, or other stimulus (IT’S A TIGER!) and release acetylcholine (ACh) onto nicotinic ACh receptors of the superior, middle, and inferior cervical ganglia, part of the sympathetic chain ganglia. These long postganglionic axons release norepinephrine onto the β-adrenergic receptors of the SA node cells, causing an increase in heart rate. (There are also β-adrenergic receptors scattered on the surface of heart muscle cells.)
Activation of the parasympathetic nervous system (red line) causes a decrease in heart rate. The cell bodies of long preganglionic neurons are found in the medulla, near other cells which control heart rate. They form part of the dorsal motor nucleus of the vagus. Their axons pass out the jugular foramen of the skull as part of the vagus nerve (cranial nerve X). Their axons release acetylcholine onto muscarinic ACh receptors of the SA pacemaker cells, causing a decrease in heart rate. (There are also muscarinic ACh receptors found throughout the heart muscle.)
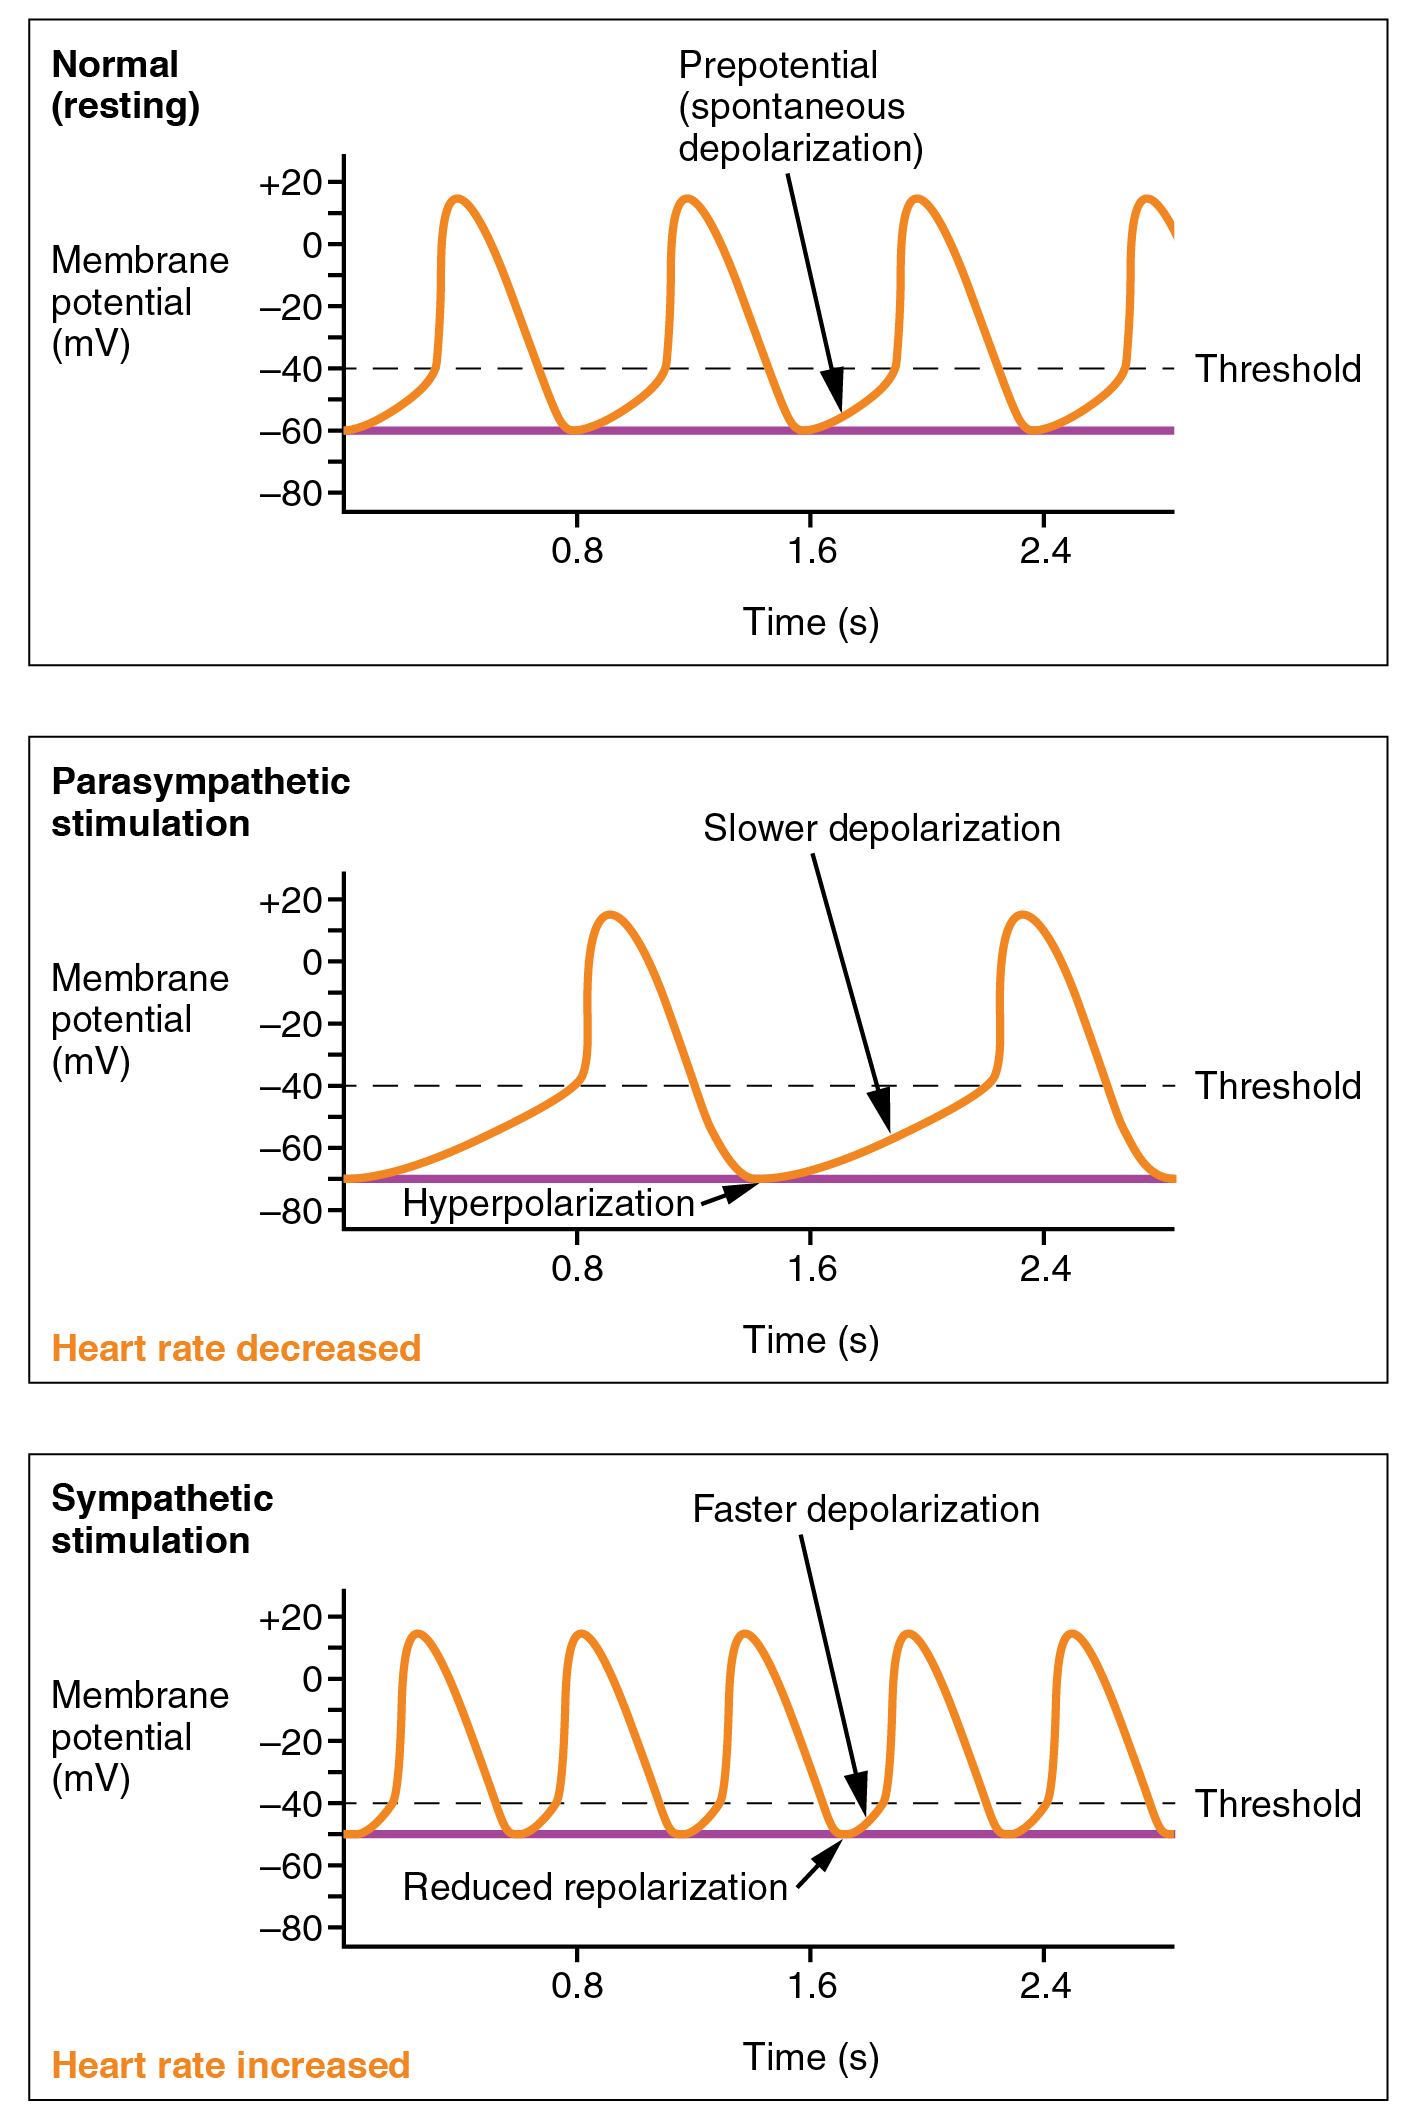 Norepinephrine and acetylcholine do not affect the action potential (“Ca2+ spike”) of the SA node pacemaker cells. Rather, they affect the slope of the prepotential which lies in between the spikes. They do this by changing the properties of the funny Na+ channel.
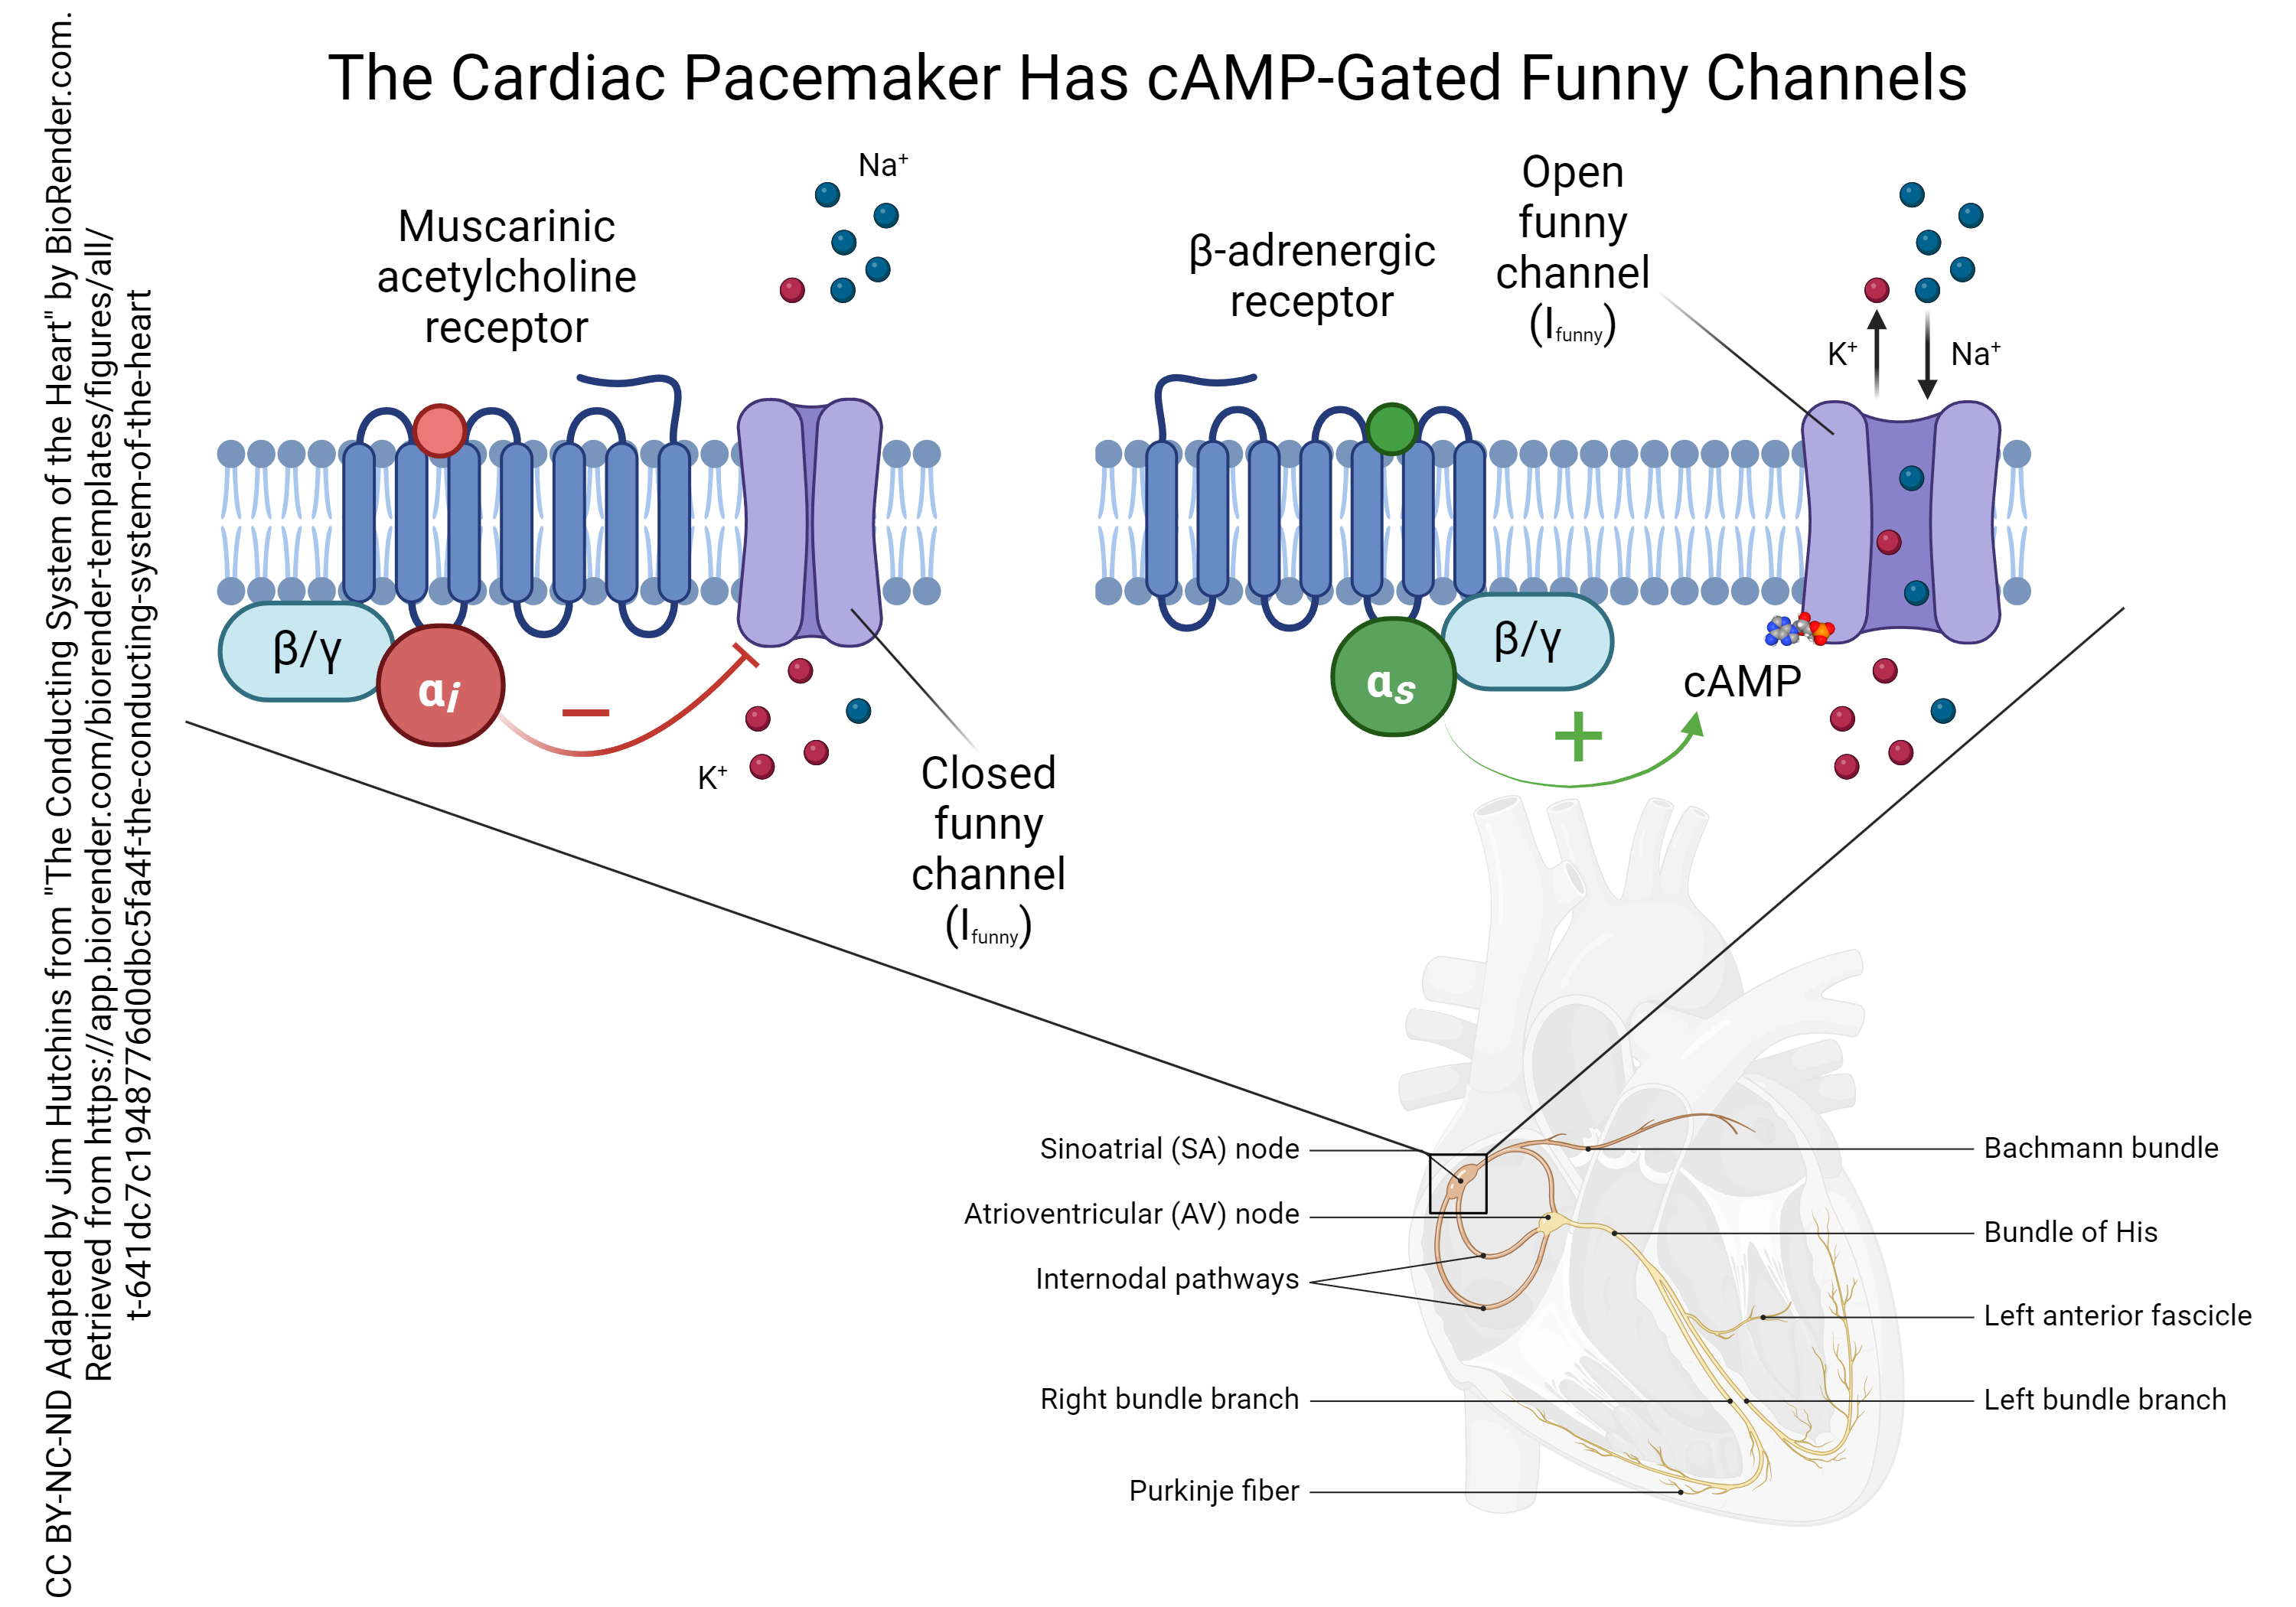 Both the muscarinic ACh receptors and the β-adrenergic receptors of the SA node pacemaker cells are G protein-coupled receptors, but they each have a different intracellular signaling pathway.
The muscarinic ACh receptor is coupled to a G protein that has an inhibitory alpha (αi) subunit. This type of subunit inhibits the formation of cyclic adenosine monophosphate (cAMP) which normally phosphorylates the funny sodium channel. This reduces the funny current (remember that current is represented by the symbol I so this current is called Ifunny). This causes a slower rise in the membrane potential of the SA node cells and a slower pacemaker rate.
The β-adrenergic receptor is coupled to a G protein that has a stimulatory alpha (αs) subunit. This stimulates the enzyme adenylyl cyclase (not shown) which in turn makes more cAMP. When cAMP binds to the funny sodium channel, it leaves a phosphate group behind. The phosphorylated funny sodium channel stays open longer, which causes a faster rise in the membrane potential and a faster pacemaker rate.
(Note that even though we call it a “funny sodium channel”, the Ifunny has a component that is K+ leaving at the same time as Na+ entering. This still depolarizes the SA node cell, because the equilibrium potential for the Ifunny is halfway between the EK and ENa, or close to 0 mV. We discussed this situation in Unit 13.)
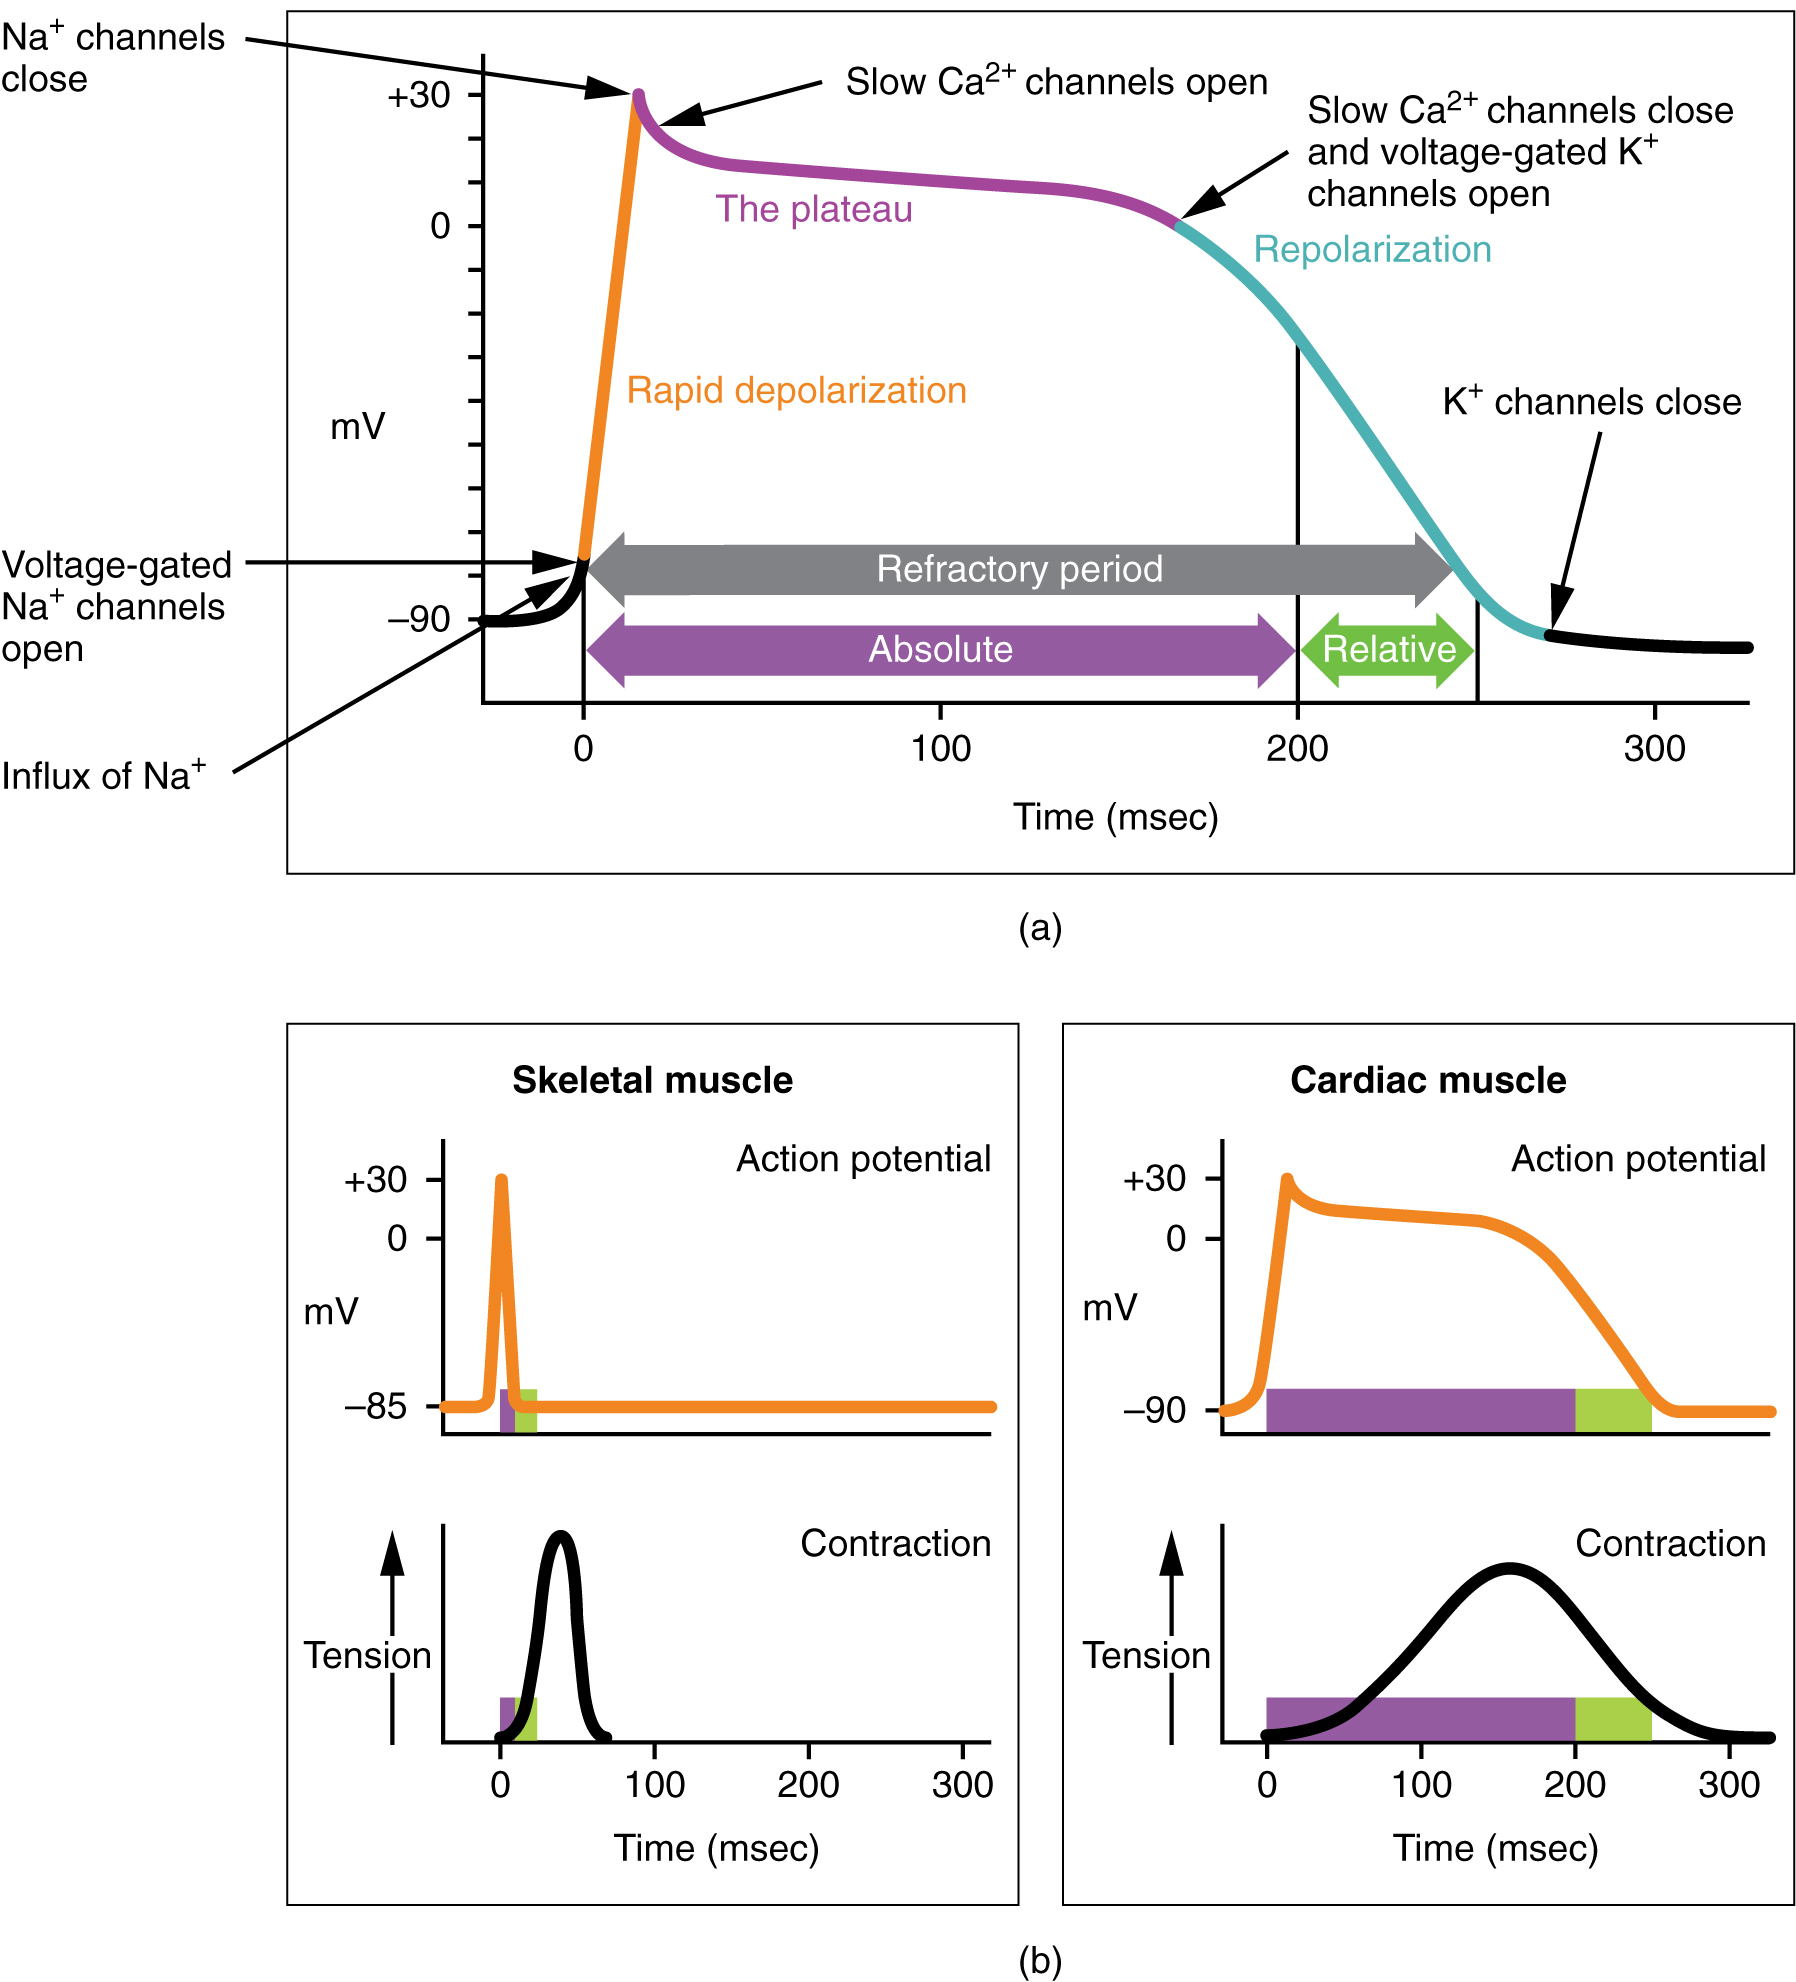 As the voltage wave initiated by the SA node travels through the bundle branches and Purkinje fibers, it triggers a cardiac muscle cell action potential which somewhat resembles the skeletal muscle action potential we studied in Unit 10 and the nerve cell action potential we studied in Unit 13. The cardiac muscle action potential lasts about 100 times longer (200 msec vs 2 msec). This sustained contraction is needed for the pumping action of the ventricles.
The Electrocardiogram (ECG or EKG)
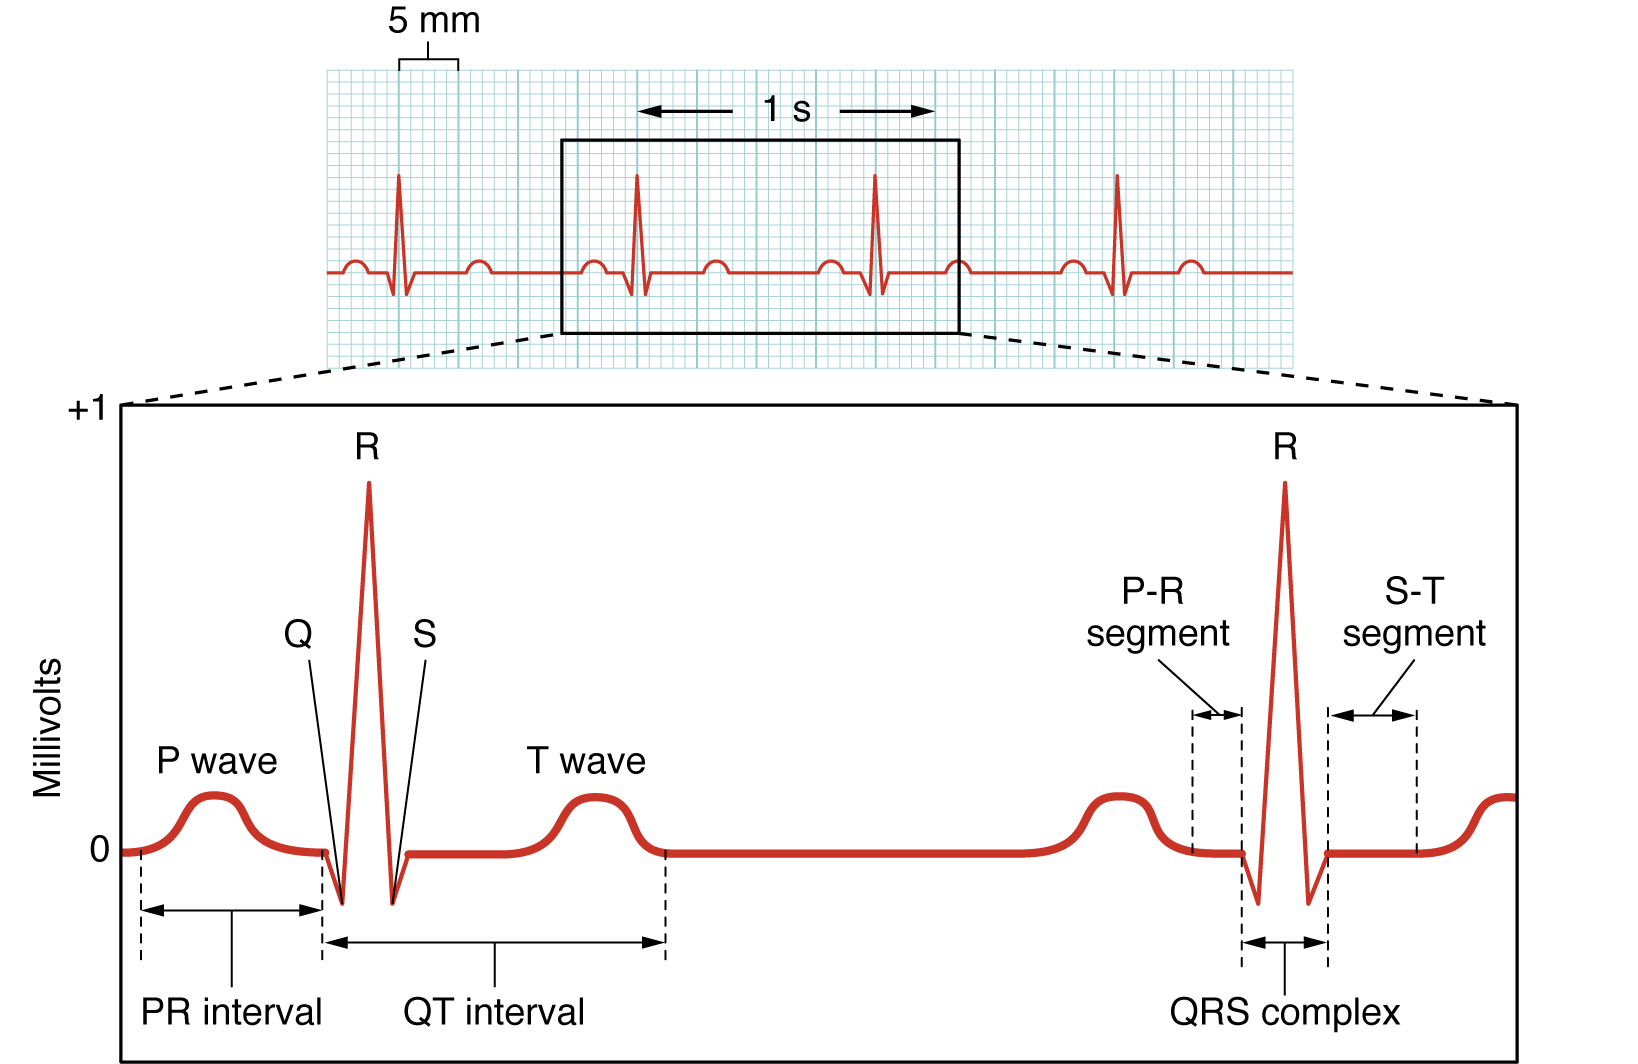 Here we see the classic electrocardiogram (ECG or EKG) trace. This is lead II of the 12-lead ECG which is the most commonly used type. Lead II is the change in electrical activity between the right arm and left leg.
The P wave represents depolarization of the atria. Remember that this is the first electrical event in the cardiac cycle; an electrical potential (voltage) wave starts at the SA node at the superior aspect of the right atrium and spreads all over the right and left atria.
The QRS complex represents depolarization of the ventricles. As the electrical potential wave spreads out the AV bundle, then the bundle branches, and into the Purkinje fiber network, a large and complex electrical wave is seen on the surface of the chest. The cardiac muscle cells of the ventricles become positively charged intracellularly and a strong contraction results.
The T wave represents ventricular repolarization. The cardiac muscle cells of the ventricles regain their normal, resting negative charge inside the cells.
It’s important to note that the relationship between the intracellular pattern of electrical activity in cardiac muscle cells (shown above) and the extracellular pattern of electrical activity (as seen in the ECG) is not at all simple. We might expect the extracellular electrical changes to be the mirror image of the intracellular ones, but it just doesn’t work that way. Among other things, the extracellular environment is structurally complex and the electrical activity can be deflected by fat, bone, and the muscles of the chest wall.
Effect of Potassium on the ECG
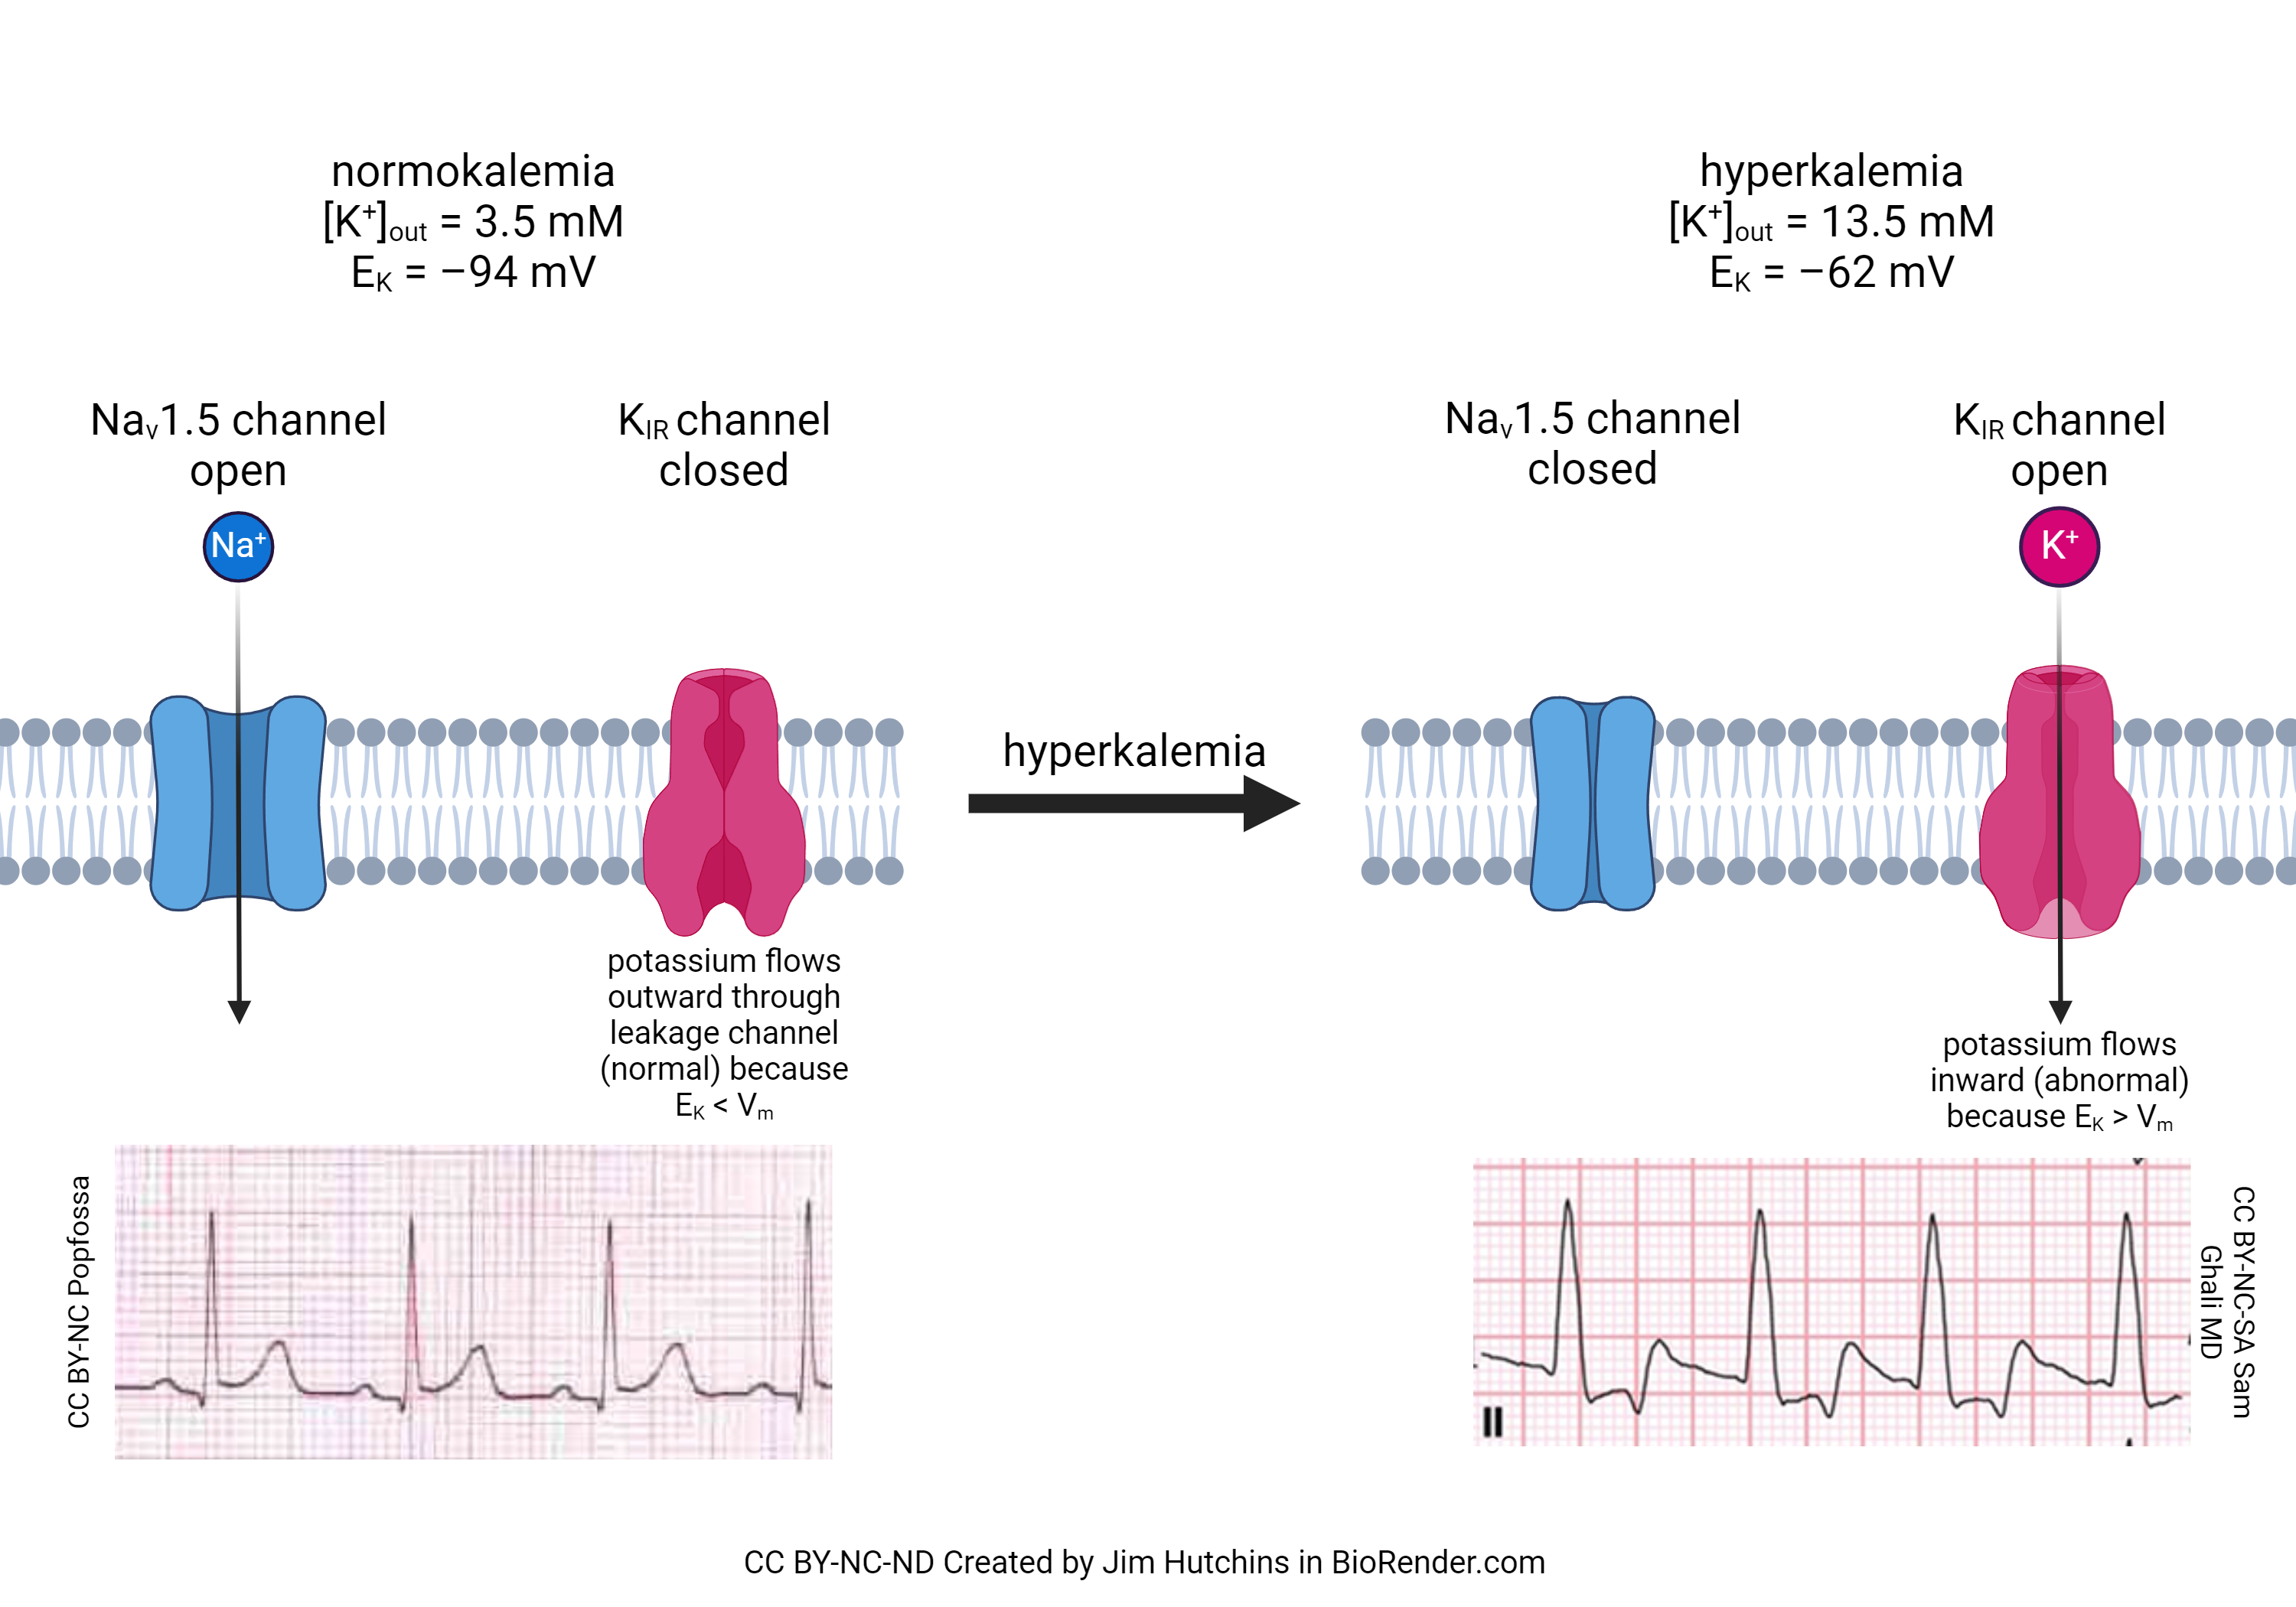 Now that we have seen the action and importance of the funny Na+ channel, we can better understand how increased blood potassium (hyperkalemia) causes a disruption in the contraction of the heart. It is well-known in the clinic that patients with hyperkalemia are at much greater risk of cardiac death than patients with normal blood potassium (normokalemia). There are two reasons for this. First, hyperkalemia closes a sodium channel we’ve not yet discussed, called the Nav1.5 channel. This allows Na+ to flow into, and depolarize, the cardiac muscle cell out of sequence. Second, there is a potassium channel (called the inward rectifying potassium channel, or KIR) which is closed at rest in normokalemia but is opened in hyperkalemia. Worse, the flow through the channel is reversed because the equilibrium potential for potassium changes. Normally, [K+]out = 5 mM and [K+]in = 100 mM. Remember that the equilibrium potential for potassium depends on the ratio of these two concentrations. The diffusion force on potassium is usually quite high, because there are 20 times more potassium ions inside the cell than outside. If we increase [K+]out to 13.5 mM, the ratio of potassium inside to outside is about 7:1 instead of 20:1. This shifts the equlibrium potential for potassium (EK) from –94 mV to –62 mV and at rest, K+ flows into the cardiac muscle cell. Because ventricular repolarization (the T wave) depends greatly on the influx of K+ at the end of the cardiac action potential, the T wave is most affected by hyperkalemia, as shown in the ECG traces in this figure.
Media Attributions
- U16-015 Conducting System of the Heart © Hutchins, Jim is licensed under a CC BY-NC-ND (Attribution NonCommercial NoDerivatives) license
- U16-016 Conduction System of the Heart © Betts, J. Gordon; Young, Kelly A.; Wise, James A.; Johnson, Eddie; Poe, Brandon; Kruse, Dean H. Korol, Oksana; Johnson, Jody E.; Womble, Mark & DeSaix, Peter is licensed under a CC BY (Attribution) license
- U16-017 Cardiac Conduction © Betts, J. Gordon; Young, Kelly A.; Wise, James A.; Johnson, Eddie; Poe, Brandon; Kruse, Dean H. Korol, Oksana; Johnson, Jody E.; Womble, Mark & DeSaix, Peter is licensed under a CC BY (Attribution) license
- U16-018 Action Potential at the SA Node © Betts, J. Gordon; Young, Kelly A.; Wise, James A.; Johnson, Eddie; Poe, Brandon; Kruse, Dean H. Korol, Oksana; Johnson, Jody E.; Womble, Mark & DeSaix, Peter is licensed under a CC BY (Attribution) license
- U16-019 Autonomic Innervation of the Heart © Cornelius, Emma is licensed under a CC BY-NC-ND (Attribution NonCommercial NoDerivatives) license
- U16-020 Effects of Parasympathetic and Sympathetic Stimulation on Normal Sinus Rhythm © Betts, J. Gordon; Young, Kelly A.; Wise, James A.; Johnson, Eddie; Poe, Brandon; Kruse, Dean H. Korol, Oksana; Johnson, Jody E.; Womble, Mark & DeSaix, Peter is licensed under a CC BY (Attribution) license
- U16-021 Role of Funny Channels in Pacemaker Activity © Hutchins, Jim is licensed under a CC BY-NC-ND (Attribution NonCommercial NoDerivatives) license
- U16-022 Action Potential in Cardiac Contractile Cells © Betts, J. Gordon; Young, Kelly A.; Wise, James A.; Johnson, Eddie; Poe, Brandon; Kruse, Dean H. Korol, Oksana; Johnson, Jody E.; Womble, Mark & DeSaix, Peter is licensed under a CC BY (Attribution) license
- U16-023 Electrocardiogram © Betts, J. Gordon; Young, Kelly A.; Wise, James A.; Johnson, Eddie; Poe, Brandon; Kruse, Dean H. Korol, Oksana; Johnson, Jody E.; Womble, Mark & DeSaix, Peter is licensed under a CC BY (Attribution) license
- U16-024 Hyperkalemia Effects on the Flow of Ions and the ECG © Hutchins, Jim is licensed under a CC BY-NC-ND (Attribution NonCommercial NoDerivatives) license
